29 Peach Tree Dr Sutton, MA 01590
Estimated Value: $688,011 - $834,000
About This Home
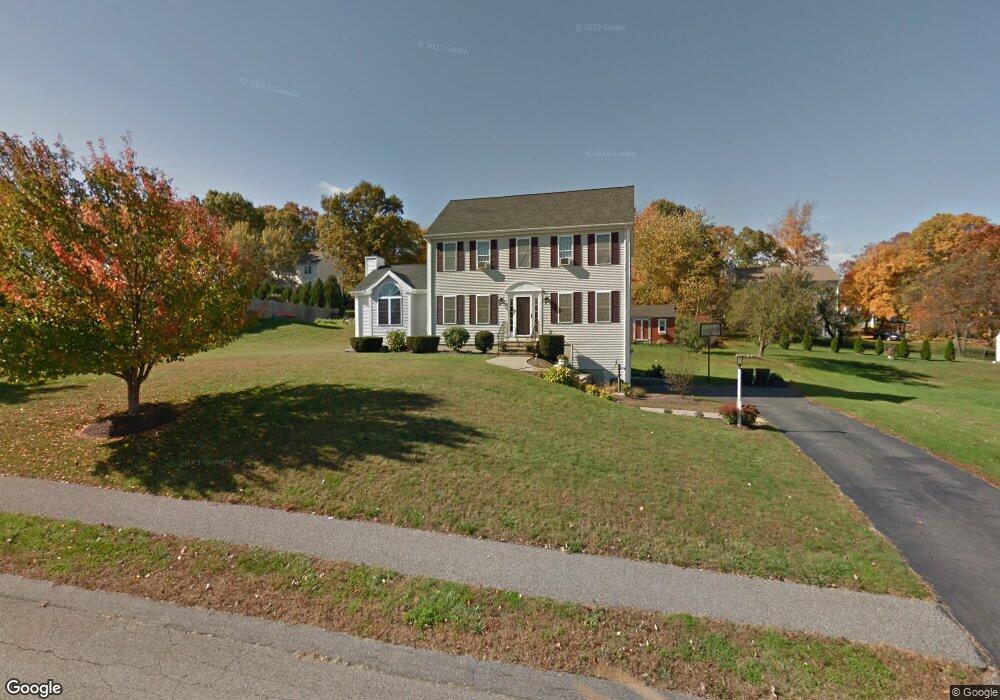
This home is located at 29 Peach Tree Dr, Sutton, MA 01590 and is currently estimated at $743,003, approximately $379 per square foot. 29 Peach Tree Dr is a home located in Worcester County with nearby schools including Sutton Elementary School, Sutton Middle School, and Sutton High School.
Ownership History
We collect this data history from publicly available records. To have your information removed, we recommend requesting removal directly through your county’s website.
Purchase Details
Home Financials for this Owner
Home Financials are based on the most recent Mortgage that was taken out on this home.Home Values in the Area
Average Home Value in this Area
Purchase History
We collect this data history from publicly available records. To have your information removed, we recommend requesting removal directly through your county’s website.
| Date | Buyer | Sale Price | Title Company |
|---|---|---|---|
| $227,363 | -- |
Mortgage History
We collect this data history from publicly available records. To have your information removed, we recommend requesting removal directly through your county’s website.
| Date | Status | Borrower | Loan Amount |
|---|---|---|---|
| Open | $260,000 | ||
| Closed | $243,000 | ||
| Closed | $216,000 |
Tax History
We collect this data history from publicly available records. To have your information removed, we recommend requesting removal directly through your county’s website.
| Year | Tax Paid | Tax Assessment Tax Assessment Total Assessment is a certain percentage of the fair market value that is determined by local assessors to be the total taxable value of land and additions on the property. | Land | Improvement |
|---|---|---|---|---|
| 2025 | $7,799 | $625,900 | $208,200 | $417,700 |
| 2024 | $7,508 | $582,500 | $181,900 | $400,600 |
| 2023 | $6,899 | $490,000 | $164,400 | $325,600 |
| 2022 | $6,635 | $427,500 | $131,600 | $295,900 |
| 2021 | $6,503 | $398,200 | $131,600 | $266,600 |
| 2020 | $6,511 | $398,200 | $131,600 | $266,600 |
| 2019 | $6,246 | $368,300 | $126,800 | $241,500 |
| 2018 | $9,657 | $353,700 | $126,800 | $226,900 |
| 2017 | $5,826 | $343,500 | $110,800 | $232,700 |
| 2016 | $9,377 | $334,700 | $110,800 | $223,900 |
| 2015 | $5,523 | $323,000 | $110,800 | $212,200 |
| 2014 | $5,429 | $311,300 | $114,300 | $197,000 |
Map
- 81 Fisherville Terrace
- 77 Fisherville Terrace
- 53 Fisherville Terrace
- 4 Leland Hill Rd
- 66 Fisherville Terrace
- 80 Fisherville Terrace
- 111 Main St
- 22 Demers St Unit 1
- 22 Demers St Unit 2
- 69 Highland View Dr
- 11 Sampson St
- 57 Depot St
- 8 River Ave
- 82 Dodge Hill Rd
- 4 Herbert Dr Unit B
- 274 Providence Rd Unit 5
- 268 Providence Rd
- 5 Okemo Ridge Rd
- 7 Follette St
- 229 & 225 Providence Rd
- 27 Peach Tree Dr
- 33 Peach Tree Dr
- 29 Leland Hill Rd
- 25 Leland Hill Rd
- 31 Leland Hill Rd
- 32 Peach Tree Dr
- 28 Peach Tree Dr
- 34 Peach Tree Dr
- 35 Peach Tree Dr
- 25 Peach Tree Dr
- 23 Leland Hill Rd
- 33 Leland Hill Rd
- 26 Peach Tree Dr
- 28 Leland Hill Rd
- 36 Peach Tree Dr
- 30 Leland Hill Rd
- 26 Leland Hill Rd
- 19 Leland Hill Rd
- 37 Peach Tree Dr
- 34 Leland Hill Rd
Ask me questions while you tour the home.