25 Peach Tree Dr Sutton, MA 01590
Sutton AreaEstimated Value: $770,000 - $886,000
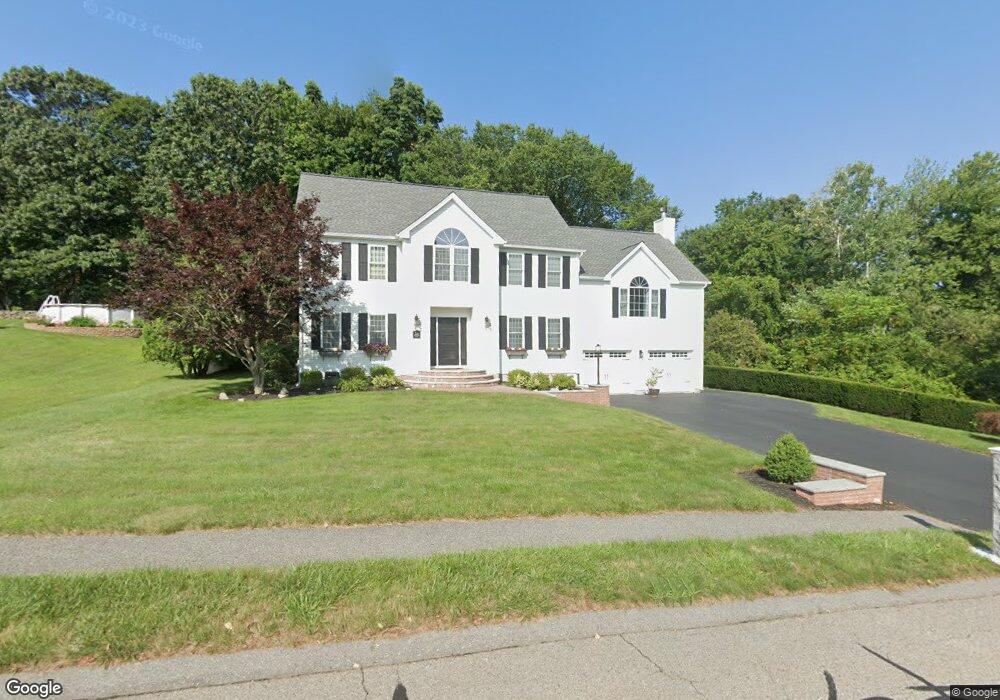
About This Home
This home is located at 25 Peach Tree Dr, Sutton, MA 01590 and is currently estimated at $836,776, approximately $306 per square foot. 25 Peach Tree Dr is a home located in Worcester County with nearby schools including Sutton Elementary School, Sutton Middle School, and Sutton High School.
Ownership History
We collect this data history from publicly available records. To have your information removed, we recommend requesting removal directly through your county’s website.
Purchase Details
Home Values in the Area
Average Home Value in this Area
Purchase History
We collect this data history from publicly available records. To have your information removed, we recommend requesting removal directly through your county’s website.
| Date | Buyer | Sale Price | Title Company |
|---|---|---|---|
| $338,283 | -- |
Tax History
We collect this data history from publicly available records. To have your information removed, we recommend requesting removal directly through your county’s website.
| Year | Tax Paid | Tax Assessment Tax Assessment Total Assessment is a certain percentage of the fair market value that is determined by local assessors to be the total taxable value of land and additions on the property. | Land | Improvement |
|---|---|---|---|---|
| 2025 | $9,475 | $760,400 | $216,300 | $544,100 |
| 2024 | $9,272 | $719,300 | $189,200 | $530,100 |
| 2023 | $8,790 | $624,300 | $171,200 | $453,100 |
| 2022 | $8,514 | $548,600 | $137,000 | $411,600 |
| 2021 | $4,970 | $507,300 | $137,000 | $370,300 |
| 2020 | $10,028 | $507,300 | $137,000 | $370,300 |
| 2019 | $7,963 | $469,500 | $132,300 | $337,200 |
| 2018 | $9,547 | $448,900 | $132,300 | $316,600 |
| 2017 | $7,484 | $441,300 | $116,500 | $324,800 |
| 2016 | $7,357 | $429,000 | $116,500 | $312,500 |
| 2015 | $7,054 | $412,500 | $116,500 | $296,000 |
| 2014 | $7,046 | $404,000 | $120,300 | $283,700 |
Map
- 18 Boundary Stone Rd
- 5 Peach Tree Dr
- 81 Fisherville Terrace
- 77 Fisherville Terrace
- 53 Fisherville Terrace
- 66 Fisherville Terrace
- 80 Fisherville Terrace
- 22 Demers St Unit 2
- 69 Highland View Dr
- 111 Main St
- 10 Strawberry Knoll Dr
- 37 Aspen Ave
- 11 Sampson St
- 123 Ferry St Unit 23
- 18 Craftsman Ct Unit 16
- 82 Dodge Hill Rd
- 110 Chipper Hill Rd
- 9 Providence Rd
- 4 Herbert Dr Unit B
- 268 Providence Rd
- 27 Peach Tree Dr
- 33 Leland Hill Rd
- 21 Peach Tree Dr
- 26 Peach Tree Dr
- 37 Leland Hill Rd
- 22 Peach Tree Dr
- 31 Leland Hill Rd
- 28 Peach Tree Dr
- 29 Peach Tree Dr
- 17 Peach Tree Dr
- 20 Peach Tree Dr
- 29 Leland Hill Rd
- 34 Leland Hill Rd
- 32 Peach Tree Dr
- 30 Leland Hill Rd
- 15 Peach Tree Dr
- 33 Peach Tree Dr
- 45 Leland Hill Rd
- 25 Leland Hill Rd
- 21 Boundary Stone Rd
Ask me questions while you tour the home.