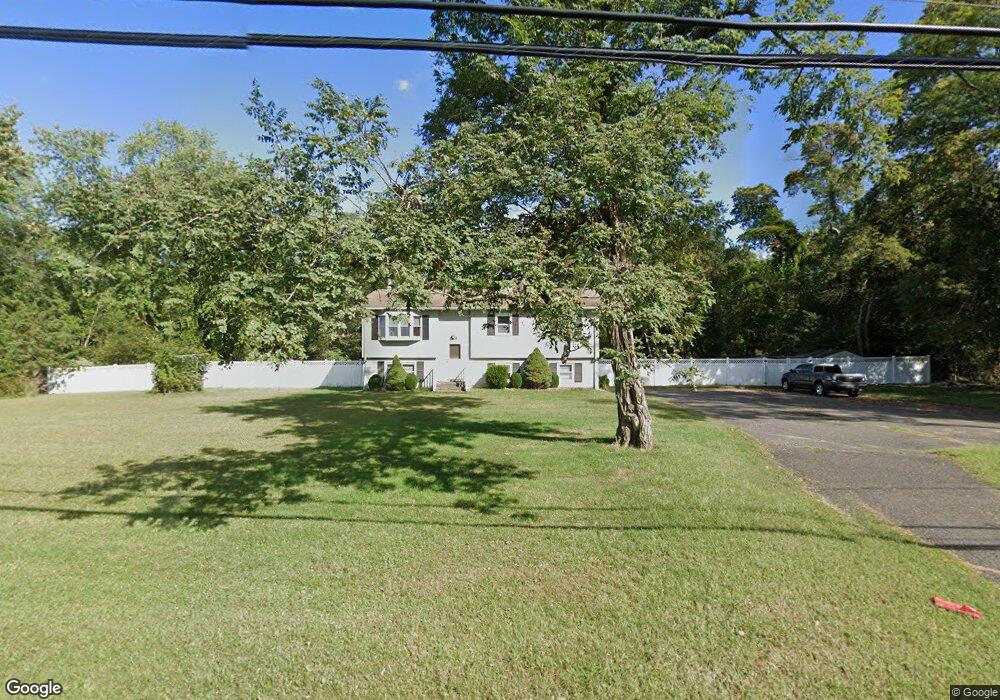
29 Richard Rd Farmingdale, NJ 07727
Adelphia NeighborhoodEstimated Value: $612,501 - $927,000
4
Beds
2
Baths
1,784
Sq Ft
$403/Sq Ft
Est. Value
About This Home
This home is located at 29 Richard Rd, Farmingdale, NJ 07727 and is currently estimated at $719,375, approximately $403 per square foot. 29 Richard Rd is a home located in Monmouth County with nearby schools including Ardena School, Adelphia Elementary School, and Howell Middle School North.
Ownership History
Date
Name
Owned For
Owner Type
Purchase Details
Closed on
Feb 1, 2006
Sold by
Nunziato Theresa
Bought by
Nunziato William H
Current Estimated Value
Purchase Details
Closed on
Mar 18, 1996
Sold by
Midstate Mtg Investors
Bought by
Manziato William
Home Financials for this Owner
Home Financials are based on the most recent Mortgage that was taken out on this home.
Original Mortgage
$121,000
Interest Rate
6.9%
Mortgage Type
FHA
Create a Home Valuation Report for This Property
The Home Valuation Report is an in-depth analysis detailing your home's value as well as a comparison with similar homes in the area
Home Values in the Area
Average Home Value in this Area
Purchase History
| Date | Buyer | Sale Price | Title Company |
|---|---|---|---|
| Nunziato William H | -- | -- | |
| Manziato William | $125,000 | -- |
Source: Public Records
Mortgage History
| Date | Status | Borrower | Loan Amount |
|---|---|---|---|
| Previous Owner | Manziato William | $121,000 |
Source: Public Records
Tax History Compared to Growth
Tax History
| Year | Tax Paid | Tax Assessment Tax Assessment Total Assessment is a certain percentage of the fair market value that is determined by local assessors to be the total taxable value of land and additions on the property. | Land | Improvement |
|---|---|---|---|---|
| 2025 | $7,656 | $434,800 | $241,800 | $193,000 |
| 2024 | $7,107 | $431,300 | $241,800 | $189,500 |
| 2023 | $7,107 | $381,700 | $196,600 | $185,100 |
| 2022 | $7,115 | $309,500 | $133,300 | $176,200 |
| 2021 | $7,115 | $310,000 | $153,300 | $156,700 |
| 2020 | $7,168 | $308,300 | $153,300 | $155,000 |
| 2019 | $7,018 | $296,100 | $143,800 | $152,300 |
| 2018 | $6,691 | $281,000 | $135,800 | $145,200 |
| 2017 | $6,543 | $271,600 | $130,800 | $140,800 |
| 2016 | $6,041 | $247,500 | $130,800 | $116,700 |
| 2015 | $6,027 | $244,500 | $130,800 | $113,700 |
| 2014 | $6,010 | $226,200 | $135,800 | $90,400 |
Source: Public Records
Map
Nearby Homes