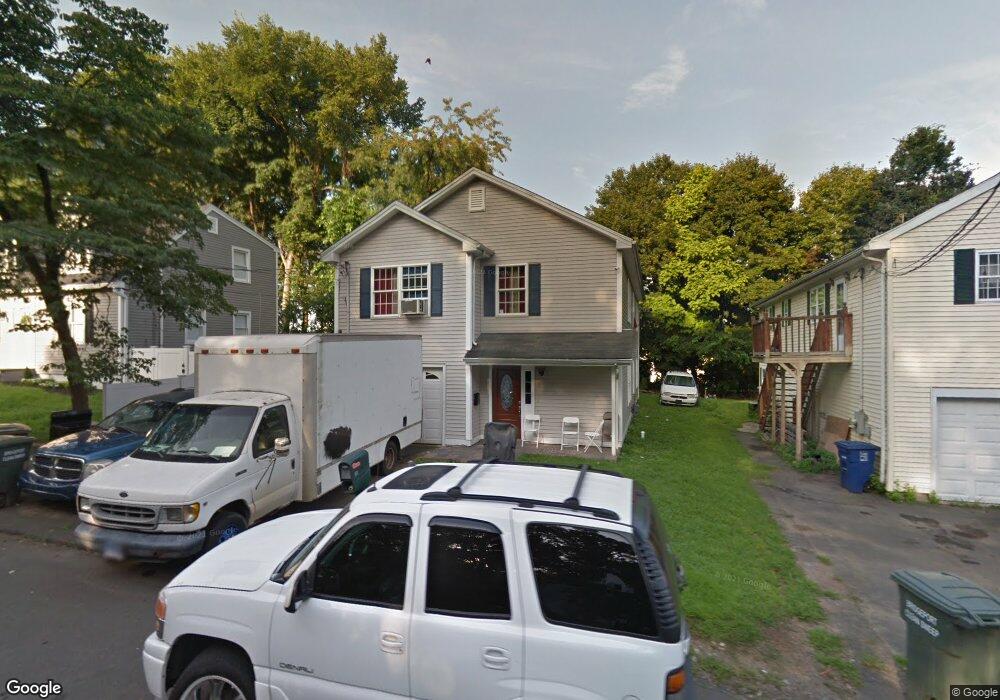
29 Robert St Bridgeport, CT 06606
Reservoir-Whiskey Hill NeighborhoodEstimated Value: $411,000 - $576,000
3
Beds
3
Baths
2,400
Sq Ft
$213/Sq Ft
Est. Value
About This Home
This home is located at 29 Robert St, Bridgeport, CT 06606 and is currently estimated at $512,115, approximately $213 per square foot. 29 Robert St is a home located in Fairfield County with nearby schools including Hallen School, Central High School, and Northeastern Adventist Academy - Fairfield County.
Ownership History
Date
Name
Owned For
Owner Type
Purchase Details
Closed on
Nov 7, 2012
Sold by
Kirby Paul
Bought by
Kirby Juliette
Current Estimated Value
Purchase Details
Closed on
Dec 9, 2005
Sold by
Guatrella Tr David
Bought by
Kirby Paul and Kirby Juliette
Home Financials for this Owner
Home Financials are based on the most recent Mortgage that was taken out on this home.
Original Mortgage
$301,500
Interest Rate
10.35%
Purchase Details
Closed on
Mar 29, 2005
Sold by
Cogan Carol
Bought by
Quatrella Tr David
Create a Home Valuation Report for This Property
The Home Valuation Report is an in-depth analysis detailing your home's value as well as a comparison with similar homes in the area
Home Values in the Area
Average Home Value in this Area
Purchase History
| Date | Buyer | Sale Price | Title Company |
|---|---|---|---|
| Kirby Juliette | -- | -- | |
| Kirby Juliette | -- | -- | |
| Kirby Paul | $335,000 | -- | |
| Kirby Paul | $335,000 | -- | |
| Quatrella Tr David | $80,000 | -- | |
| Cogan Carol | $350,000 | -- | |
| Quatrella Tr David | $80,000 | -- |
Source: Public Records
Mortgage History
| Date | Status | Borrower | Loan Amount |
|---|---|---|---|
| Previous Owner | Quatrella Tr David | $301,500 |
Source: Public Records
Tax History
| Year | Tax Paid | Tax Assessment Tax Assessment Total Assessment is a certain percentage of the fair market value that is determined by local assessors to be the total taxable value of land and additions on the property. | Land | Improvement |
|---|---|---|---|---|
| 2025 | $8,859 | $203,900 | $64,930 | $138,970 |
| 2024 | $8,859 | $203,900 | $64,930 | $138,970 |
| 2023 | $8,859 | $203,900 | $64,930 | $138,970 |
| 2022 | $8,859 | $203,900 | $64,930 | $138,970 |
| 2021 | $8,859 | $203,900 | $64,930 | $138,970 |
| 2020 | $8,535 | $158,090 | $30,690 | $127,400 |
| 2019 | $8,535 | $158,090 | $30,690 | $127,400 |
| 2018 | $8,595 | $158,090 | $30,690 | $127,400 |
| 2017 | $8,595 | $158,090 | $30,690 | $127,400 |
| 2016 | $8,595 | $158,090 | $30,690 | $127,400 |
| 2015 | $8,451 | $200,250 | $41,410 | $158,840 |
| 2014 | $8,451 | $200,250 | $41,410 | $158,840 |
Source: Public Records
Map
Nearby Homes
- 403 Indian Ave
- 245 Indian Ave
- 125 Robert St
- 474 Indian Ave
- 138 Infield St
- 45 Polk St
- 360 Saunders Ave
- 926 Hart St
- 916 Hart St
- 28 Wilkins Ave
- 110 Wilkins Ave
- 940 Reservoir Ave
- 235 Douglas St
- 769 Sylvan Ave Unit 13
- 329 Ezra St
- 420 Greenwood St
- 1265 Lindley St
- 936 Lindley St
- 45 Stevens St Unit 3L
- 355 Exeter St
Your Personal Tour Guide
Ask me questions while you tour the home.