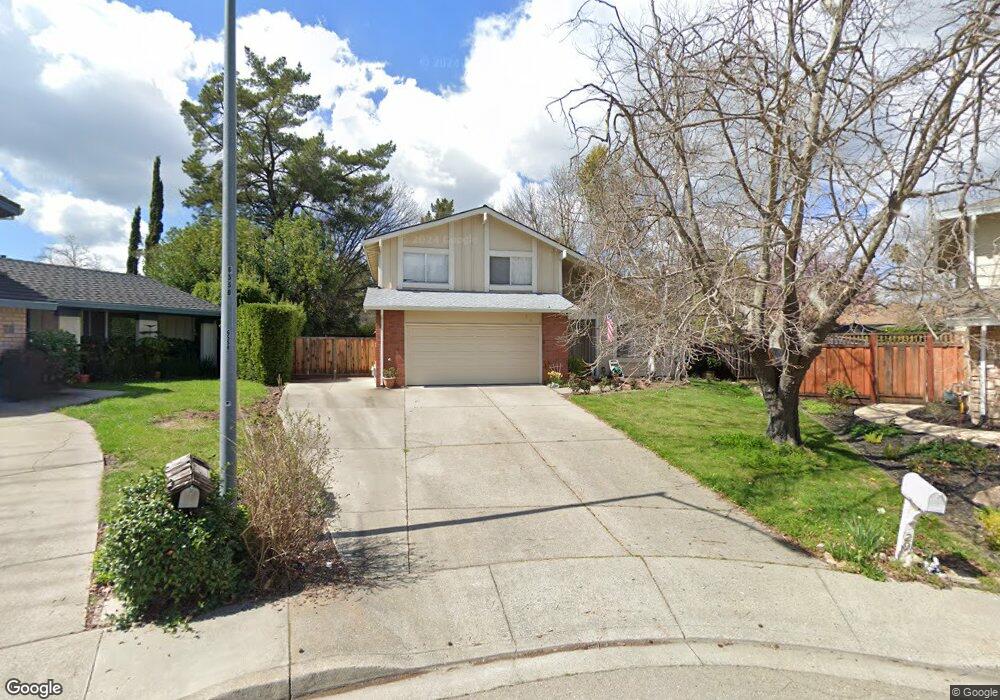
29 Saba Ct San Ramon, CA 94583
Twin Creeks NeighborhoodEstimated Value: $1,499,000 - $1,690,000
3
Beds
3
Baths
2,029
Sq Ft
$793/Sq Ft
Est. Value
About This Home
This home is located at 29 Saba Ct, San Ramon, CA 94583 and is currently estimated at $1,610,004, approximately $793 per square foot. 29 Saba Ct is a home located in Contra Costa County with nearby schools including Bollinger Canyon Elementary School, Iron Horse Middle School, and California High School.
Ownership History
Date
Name
Owned For
Owner Type
Purchase Details
Closed on
Jul 19, 2007
Sold by
Charles Heinrich F and Charles Heinrich
Bought by
Charles Heinrich F
Current Estimated Value
Purchase Details
Closed on
Sep 27, 2002
Sold by
Roberts Kevin James and Roberts Judy
Bought by
Charles Heinrich and Charles Marcie
Home Financials for this Owner
Home Financials are based on the most recent Mortgage that was taken out on this home.
Original Mortgage
$480,000
Outstanding Balance
$202,118
Interest Rate
6.22%
Mortgage Type
Stand Alone First
Estimated Equity
$1,407,886
Purchase Details
Closed on
Jun 19, 2002
Sold by
Roberts Kevin J
Bought by
Roberts Kevin J and Roberts Judith M
Purchase Details
Closed on
Jul 26, 2001
Sold by
Blauth Gerhard
Bought by
Roberts Kevin J
Home Financials for this Owner
Home Financials are based on the most recent Mortgage that was taken out on this home.
Original Mortgage
$410,000
Interest Rate
7.15%
Mortgage Type
Stand Alone First
Purchase Details
Closed on
Sep 12, 1998
Sold by
Gerhard Blauth
Bought by
Blauth Gerhard
Create a Home Valuation Report for This Property
The Home Valuation Report is an in-depth analysis detailing your home's value as well as a comparison with similar homes in the area
Home Values in the Area
Average Home Value in this Area
Purchase History
| Date | Buyer | Sale Price | Title Company |
|---|---|---|---|
| Charles Heinrich F | -- | Old Republic Title Company | |
| Charles Heinrich F | -- | Old Republic Title Company | |
| Charles Heinrich | $600,000 | First California Title | |
| Roberts Kevin J | -- | -- | |
| Roberts Kevin J | $410,000 | American Title Co | |
| Roberts Kevin J | -- | American Title Co | |
| Blauth Gerhard | -- | -- |
Source: Public Records
Mortgage History
| Date | Status | Borrower | Loan Amount |
|---|---|---|---|
| Open | Charles Heinrich | $480,000 | |
| Previous Owner | Roberts Kevin J | $410,000 | |
| Closed | Charles Heinrich | $60,000 |
Source: Public Records
Tax History Compared to Growth
Tax History
| Year | Tax Paid | Tax Assessment Tax Assessment Total Assessment is a certain percentage of the fair market value that is determined by local assessors to be the total taxable value of land and additions on the property. | Land | Improvement |
|---|---|---|---|---|
| 2025 | $10,263 | $868,982 | $550,358 | $318,624 |
| 2024 | $10,095 | $851,944 | $539,567 | $312,377 |
| 2023 | $10,095 | $835,240 | $528,988 | $306,252 |
| 2022 | $10,020 | $818,864 | $518,616 | $300,248 |
| 2021 | $9,803 | $802,809 | $508,448 | $294,361 |
| 2019 | $9,590 | $778,999 | $493,368 | $285,631 |
| 2018 | $9,234 | $763,726 | $483,695 | $280,031 |
| 2017 | $8,897 | $748,752 | $474,211 | $274,541 |
| 2016 | $8,781 | $734,071 | $464,913 | $269,158 |
| 2015 | $8,666 | $723,045 | $457,930 | $265,115 |
| 2014 | $8,545 | $708,882 | $448,960 | $259,922 |
Source: Public Records
Map
Nearby Homes
- 2482 Wildhorse Dr
- Plan 3 at City Village - The Courts
- Plan 3 at City Village - The Towns
- Plan 1 at City Village - The Courts
- Plan 1 at City Village - The Towns
- Plan 3X at City Village - The Courts
- Plan 1X at City Village - The Courts
- Plan 2 at City Village - The Towns
- Plan 1 at City Village - The Rows
- Plan 4 at City Village - The Towns
- Plan 2 at City Village - The Rows
- Plan 2 at City Village - The Courts
- Plan 3 at City Village - The Rows
- 600 Guaymas Ct
- 3104 Sombrero Cir
- 2632 Campeche Ct
- 321 Isabelline Ct
- 528 Lapis Ct
- 322 Isabelline Ct
- 326 Isabelline Ct
- 28 Saba Ct
- 25 Saba Ct
- 305 Cardona Cir
- 2333 Talavera Dr
- 309 Cardona Cir
- 2329 Talavera Dr
- 301 Cardona Cir
- 24 Saba Ct
- 339 Cardona Cir
- 317 Cardona Cir
- 2325 Talavera Dr
- 345 Cardona Cir
- 329 Cardona Cir
- 15 Lorca Ct
- 304 Cardona Cir
- 308 Cardona Cir
- 351 Cardona Cir
- 300 Cardona Cir
- 2321 Talavera Dr
- 312 Cardona Cir