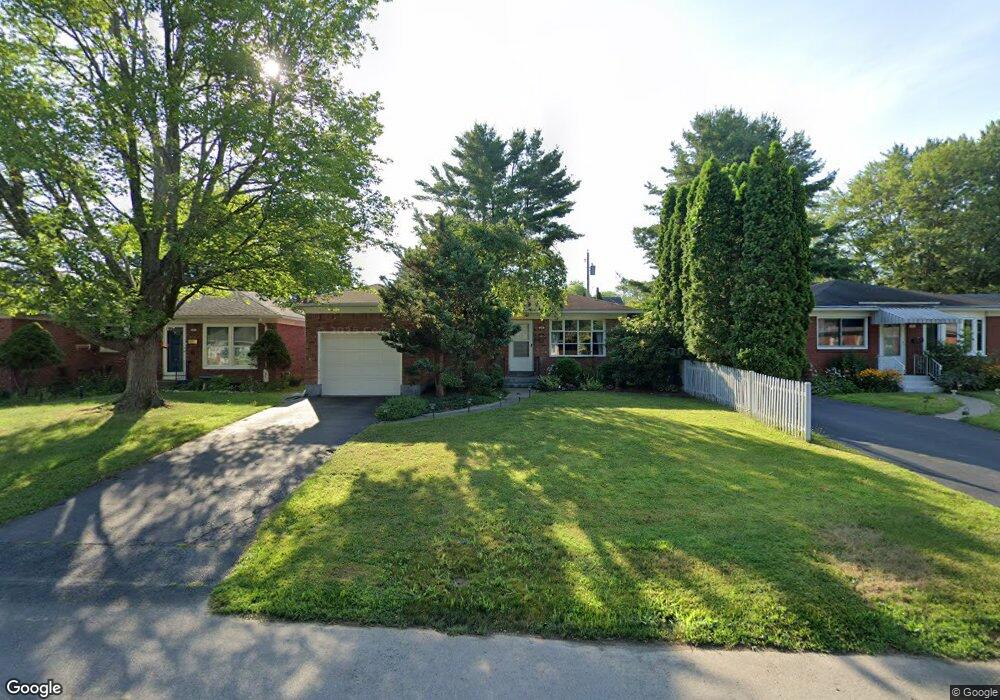
29 Tryon St Albany, NY 12203
Campus Area NeighborhoodEstimated Value: $271,000 - $305,000
3
Beds
2
Baths
1,040
Sq Ft
$278/Sq Ft
Est. Value
About This Home
This home is located at 29 Tryon St, Albany, NY 12203 and is currently estimated at $288,850, approximately $277 per square foot. 29 Tryon St is a home located in Albany County with nearby schools including Eagle Point Elementary School, William S Hackett Middle School, and Albany High School.
Ownership History
Date
Name
Owned For
Owner Type
Purchase Details
Closed on
Sep 18, 2009
Sold by
Wood Diane M
Bought by
Coronado Pedro
Current Estimated Value
Home Financials for this Owner
Home Financials are based on the most recent Mortgage that was taken out on this home.
Original Mortgage
$90,000
Outstanding Balance
$59,128
Interest Rate
5.28%
Estimated Equity
$229,722
Purchase Details
Closed on
Aug 8, 2003
Sold by
Lofrumento Michele
Bought by
Wood Diane M
Purchase Details
Closed on
Jun 11, 1999
Create a Home Valuation Report for This Property
The Home Valuation Report is an in-depth analysis detailing your home's value as well as a comparison with similar homes in the area
Home Values in the Area
Average Home Value in this Area
Purchase History
| Date | Buyer | Sale Price | Title Company |
|---|---|---|---|
| Coronado Pedro | $190,000 | None Available | |
| Wood Diane M | $136,000 | Freidman Molinsek | |
| -- | -- | -- | |
| Lofrumento Michele M | -- | -- |
Source: Public Records
Mortgage History
| Date | Status | Borrower | Loan Amount |
|---|---|---|---|
| Open | Coronado Pedro | $90,000 |
Source: Public Records
Tax History Compared to Growth
Tax History
| Year | Tax Paid | Tax Assessment Tax Assessment Total Assessment is a certain percentage of the fair market value that is determined by local assessors to be the total taxable value of land and additions on the property. | Land | Improvement |
|---|---|---|---|---|
| 2024 | $5,317 | $223,000 | $44,600 | $178,400 |
| 2023 | $6,660 | $180,000 | $36,000 | $144,000 |
| 2022 | $6,437 | $180,000 | $36,000 | $144,000 |
| 2021 | $6,397 | $180,000 | $36,000 | $144,000 |
| 2020 | $6,192 | $180,000 | $36,000 | $144,000 |
| 2019 | $7,087 | $180,000 | $36,000 | $144,000 |
| 2018 | $6,196 | $180,000 | $36,000 | $144,000 |
| 2017 | $2,613 | $180,000 | $36,000 | $144,000 |
| 2016 | $6,015 | $180,000 | $36,000 | $144,000 |
| 2015 | $6,251 | $187,900 | $37,600 | $150,300 |
| 2014 | -- | $187,900 | $37,600 | $150,300 |
Source: Public Records
Map
Nearby Homes