290 Bridge St Northampton, MA 01060
Estimated Value: $388,401 - $544,000
6
Beds
2
Baths
2,371
Sq Ft
$191/Sq Ft
Est. Value
About This Home
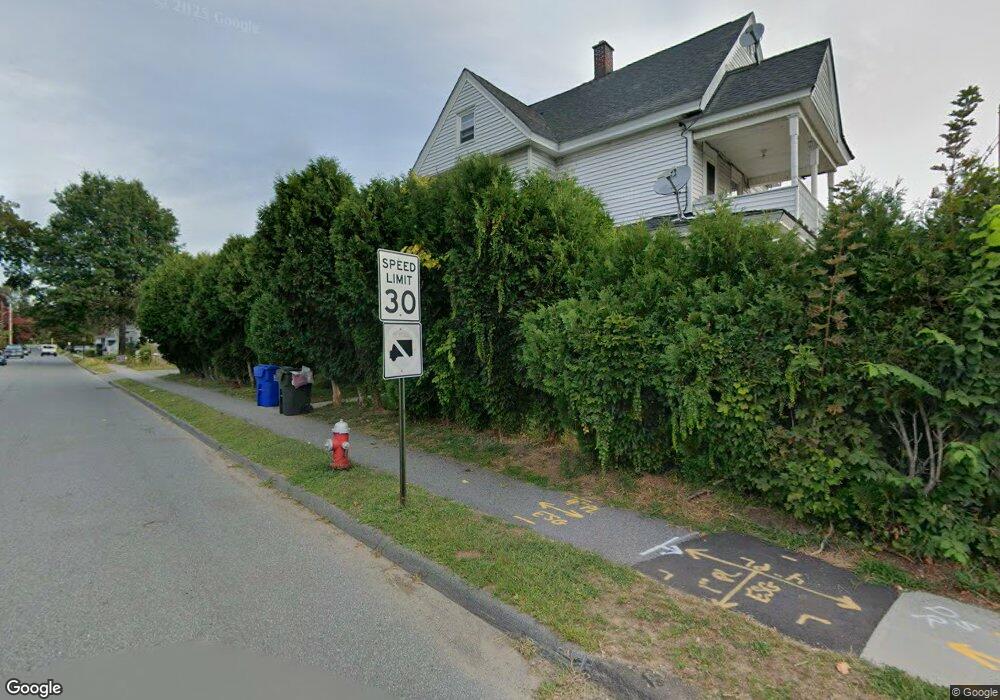
This home is located at 290 Bridge St, Northampton, MA 01060 and is currently estimated at $452,600, approximately $190 per square foot. 290 Bridge St is a home located in Hampshire County with nearby schools including Northampton High School, The Montessori School of Northampton, and Campus School of Smith College.
Ownership History
Date
Name
Owned For
Owner Type
Purchase Details
Closed on
Jun 28, 2016
Sold by
Wells Fargo Bank Na Tr
Bought by
Chow Huong C
Current Estimated Value
Purchase Details
Closed on
May 29, 2015
Sold by
Buri Jose and Wells Fargo Bank Na
Bought by
Wells Fargo Bank Na Tr
Purchase Details
Closed on
Nov 14, 2006
Sold by
Akers William F
Bought by
Buri Jose
Home Financials for this Owner
Home Financials are based on the most recent Mortgage that was taken out on this home.
Original Mortgage
$313,000
Interest Rate
6.31%
Mortgage Type
Purchase Money Mortgage
Purchase Details
Closed on
May 25, 2001
Sold by
Svoboda David L
Bought by
Akers William F
Home Financials for this Owner
Home Financials are based on the most recent Mortgage that was taken out on this home.
Original Mortgage
$177,219
Interest Rate
7.05%
Mortgage Type
Purchase Money Mortgage
Create a Home Valuation Report for This Property
The Home Valuation Report is an in-depth analysis detailing your home's value as well as a comparison with similar homes in the area
Home Values in the Area
Average Home Value in this Area
Purchase History
| Date | Buyer | Sale Price | Title Company |
|---|---|---|---|
| Chow Huong C | $238,599 | -- | |
| Wells Fargo Bank Na Tr | $262,000 | -- | |
| Buri Jose | $313,000 | -- | |
| Akers William F | $180,000 | -- |
Source: Public Records
Mortgage History
| Date | Status | Borrower | Loan Amount |
|---|---|---|---|
| Previous Owner | Buri Jose | $313,000 | |
| Previous Owner | Akers William F | $256,800 | |
| Previous Owner | Akers William F | $180,000 | |
| Previous Owner | Akers William F | $177,219 | |
| Previous Owner | Akers William F | $120,000 |
Source: Public Records
Tax History
| Year | Tax Paid | Tax Assessment Tax Assessment Total Assessment is a certain percentage of the fair market value that is determined by local assessors to be the total taxable value of land and additions on the property. | Land | Improvement |
|---|---|---|---|---|
| 2025 | $4,056 | $291,200 | $140,000 | $151,200 |
| 2024 | $4,375 | $288,000 | $160,500 | $127,500 |
| 2023 | $4,499 | $284,000 | $145,800 | $138,200 |
| 2022 | $4,465 | $249,600 | $136,300 | $113,300 |
| 2021 | $3,830 | $220,500 | $129,900 | $90,600 |
| 2020 | $3,704 | $220,500 | $129,900 | $90,600 |
| 2019 | $3,740 | $215,300 | $129,900 | $85,400 |
| 2018 | $3,655 | $214,500 | $129,900 | $84,600 |
| 2017 | $3,580 | $214,500 | $129,900 | $84,600 |
| 2016 | $4,869 | $301,300 | $129,900 | $171,400 |
| 2015 | $4,644 | $293,900 | $122,400 | $171,500 |
| 2014 | $4,523 | $293,900 | $122,400 | $171,500 |
Source: Public Records
Map
Nearby Homes
- 22 Woodbine Ave
- 20 View Ave Unit A
- 30 View Ave
- 25 Union St
- 25 Union St Unit 2
- 13A Finn St
- 13 Finn St
- 10 Hawley St Unit 4C
- 10 Hawley St Unit 4D
- 10 Hawley St Unit 4B
- 10 Hawley St Unit 4A
- 51 Phillips Place Unit 1
- 37 Finn St
- 19 Trumbull Rd
- 61 Crescent St Unit 8
- 61 Crescent St Unit 7
- 30 Pleasant St Unit 4
- 23 Eastern Ave
- 29 Pleasant St Unit 1
- 43 Center St Unit K
Your Personal Tour Guide
Ask me questions while you tour the home.