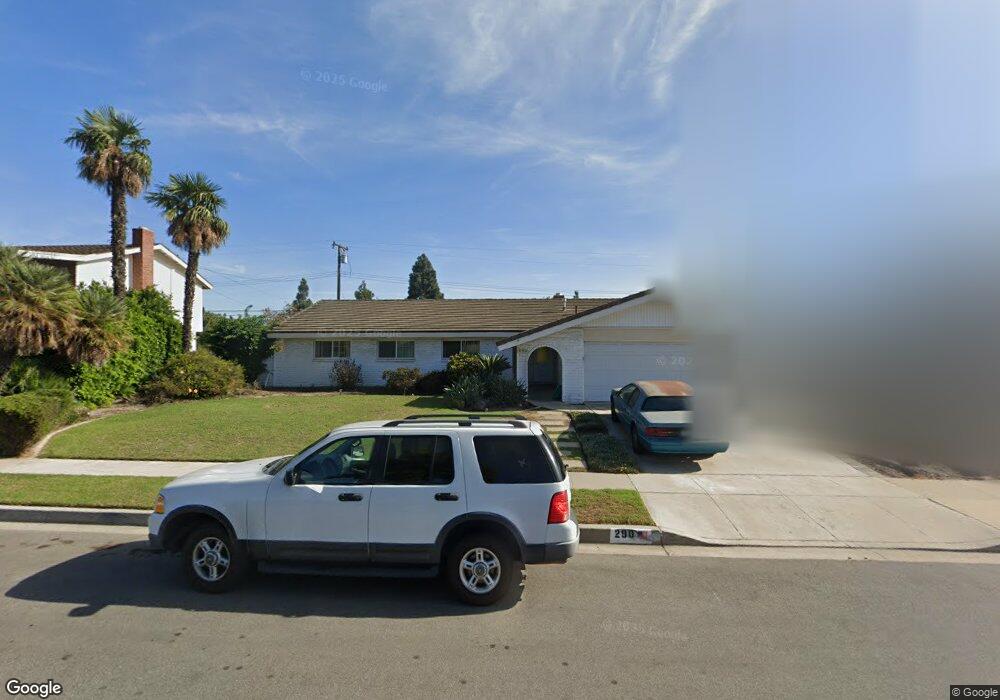
290 Calle Portilla Camarillo, CA 93010
Estimated Value: $900,671 - $1,094,000
4
Beds
2
Baths
1,727
Sq Ft
$580/Sq Ft
Est. Value
About This Home
This home is located at 290 Calle Portilla, Camarillo, CA 93010 and is currently estimated at $1,001,168, approximately $579 per square foot. 290 Calle Portilla is a home located in Ventura County with nearby schools including Las Posas Elementary School, Monte Vista Middle School, and Camarillo Academy of Progressive Education.
Ownership History
Date
Name
Owned For
Owner Type
Purchase Details
Closed on
Aug 22, 2024
Sold by
Scott Betty J
Bought by
Scott Betty J and Bustamante Judith
Current Estimated Value
Home Financials for this Owner
Home Financials are based on the most recent Mortgage that was taken out on this home.
Original Mortgage
$1,290,000
Interest Rate
6.79%
Mortgage Type
Reverse Mortgage Home Equity Conversion Mortgage
Purchase Details
Closed on
Aug 14, 1995
Sold by
Sutcliffe Albert G and Sutcliffe Dolores A
Bought by
Scott Betty J
Home Financials for this Owner
Home Financials are based on the most recent Mortgage that was taken out on this home.
Original Mortgage
$67,500
Interest Rate
7.63%
Create a Home Valuation Report for This Property
The Home Valuation Report is an in-depth analysis detailing your home's value as well as a comparison with similar homes in the area
Home Values in the Area
Average Home Value in this Area
Purchase History
| Date | Buyer | Sale Price | Title Company |
|---|---|---|---|
| Scott Betty J | $1,290,000 | None Listed On Document | |
| Scott Betty J | $197,500 | Lincoln Title Co |
Source: Public Records
Mortgage History
| Date | Status | Borrower | Loan Amount |
|---|---|---|---|
| Open | Scott Betty J | $1,290,000 | |
| Previous Owner | Scott Betty J | $1,290,000 | |
| Previous Owner | Scott Betty J | $67,500 |
Source: Public Records
Tax History Compared to Growth
Tax History
| Year | Tax Paid | Tax Assessment Tax Assessment Total Assessment is a certain percentage of the fair market value that is determined by local assessors to be the total taxable value of land and additions on the property. | Land | Improvement |
|---|---|---|---|---|
| 2025 | $3,583 | $328,034 | $131,211 | $196,823 |
| 2024 | $3,583 | $321,602 | $128,638 | $192,964 |
| 2023 | $3,454 | $315,297 | $126,116 | $189,181 |
| 2022 | $3,442 | $309,115 | $123,643 | $185,472 |
| 2021 | $3,318 | $303,054 | $121,218 | $181,836 |
| 2020 | $3,305 | $299,948 | $119,976 | $179,972 |
| 2019 | $3,288 | $294,068 | $117,624 | $176,444 |
| 2018 | $3,227 | $288,303 | $115,318 | $172,985 |
| 2017 | $3,038 | $282,651 | $113,057 | $169,594 |
| 2016 | $2,965 | $277,110 | $110,841 | $166,269 |
| 2015 | $2,933 | $272,949 | $109,177 | $163,772 |
| 2014 | $2,864 | $267,605 | $107,040 | $160,565 |
Source: Public Records
Map
Nearby Homes
- 51 Calle Escalon
- 308 Calle Converse
- 73 Paseo Esplendido
- 813 N Calle Circulo
- 106 Calle Bella Vista
- 1075 Seybolt Ave
- 858 Calle Portilla
- 85 Crestview Ave
- 1665 Avenida Soltura
- 860 Big Horn Ct
- 800 Calle Higuera
- 25 Encino Ave
- 166 Bramble Ct
- 1974 Sierra Mesa Dr
- 756 Edward Scholle Dr
- 808 N Highland Dr
- 405 Paseo Del Valle
- 170 Spanish Moss Place
- 2048 Sierra Mesa Dr
- 921 Camino Vera Cruz
- 308 Calle Portilla
- 274 Calle Portilla
- 330 Calle Portilla
- 258 Calle Portilla
- 295 Calle Portilla
- 273 Calle Portilla
- 261 Calle Portilla
- 352 Calle Portilla
- 240 Calle Portilla
- 12 Camino Estrada
- 51 Camino Estrada
- 249 Calle Portilla
- 38 Camino Estrada
- 368 Calle Portilla
- 224 Calle Portilla
- 286 Calle Navarro
- 9 Camino Castanada
- 85 Camino Estrada
- 235 Calle Portilla
- 264 Calle Navarro