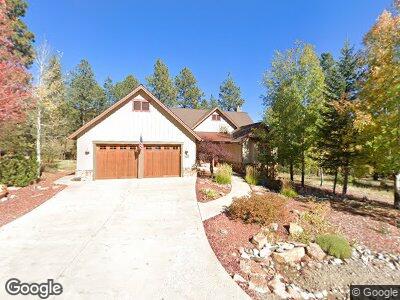
290 Copper Rim Trail Durango, CO 81301
Edgemont NeighborhoodEstimated Value: $944,855 - $1,124,000
3
Beds
2
Baths
2,339
Sq Ft
$456/Sq Ft
Est. Value
About This Home
This home is located at 290 Copper Rim Trail, Durango, CO 81301 and is currently estimated at $1,065,964, approximately $455 per square foot. 290 Copper Rim Trail is a home located in La Plata County with nearby schools including Riverview Elementary School, Miller Middle School, and Durango High School.
Ownership History
Date
Name
Owned For
Owner Type
Purchase Details
Closed on
Jul 17, 2020
Sold by
Klos Gregory S and Dillon Jill W
Bought by
Rankin John K and Rankin Barbara A
Current Estimated Value
Purchase Details
Closed on
Nov 15, 2017
Sold by
Beard Delmar D and Beard Patricia L
Bought by
Klos Gregory S and Dillon Jill W
Home Financials for this Owner
Home Financials are based on the most recent Mortgage that was taken out on this home.
Original Mortgage
$370,000
Interest Rate
3.85%
Mortgage Type
New Conventional
Purchase Details
Closed on
Aug 22, 2007
Sold by
Turpin Russ and Turpin Pamela M
Bought by
Beard Delmar D and Beard Patricia L
Purchase Details
Closed on
Jan 16, 2004
Bought by
Klos Gregory S
Create a Home Valuation Report for This Property
The Home Valuation Report is an in-depth analysis detailing your home's value as well as a comparison with similar homes in the area
Home Values in the Area
Average Home Value in this Area
Purchase History
| Date | Buyer | Sale Price | Title Company |
|---|---|---|---|
| Rankin John K | $650,000 | Land Title Guarantee Co | |
| Klos Gregory S | $610,000 | Land Title Guarantee Co | |
| Beard Delmar D | -- | Land Title | |
| Klos Gregory S | $101,700 | -- |
Source: Public Records
Mortgage History
| Date | Status | Borrower | Loan Amount |
|---|---|---|---|
| Previous Owner | Klos Gregory S | $370,000 | |
| Previous Owner | Turpin Russ | $160,000 | |
| Previous Owner | Turpin Russ | $280,000 |
Source: Public Records
Tax History Compared to Growth
Tax History
| Year | Tax Paid | Tax Assessment Tax Assessment Total Assessment is a certain percentage of the fair market value that is determined by local assessors to be the total taxable value of land and additions on the property. | Land | Improvement |
|---|---|---|---|---|
| 2024 | $2,125 | $42,400 | $10,370 | $32,030 |
| 2023 | $2,125 | $45,530 | $11,140 | $34,390 |
| 2022 | $2,325 | $47,810 | $11,700 | $36,110 |
| 2021 | $2,353 | $46,200 | $9,430 | $36,770 |
| 2020 | $2,273 | $45,620 | $9,050 | $36,570 |
| 2019 | $2,199 | $45,620 | $9,050 | $36,570 |
| 2018 | $2,047 | $42,180 | $9,300 | $32,880 |
| 2016 | $1,834 | $40,610 | $9,970 | $30,640 |
| 2015 | $1,754 | $40,610 | $9,970 | $30,640 |
| 2014 | -- | $36,110 | $8,650 | $27,460 |
| 2013 | -- | $36,110 | $8,650 | $27,460 |
Source: Public Records
Map
Nearby Homes
- 89 Kenosha Ct
- 76 Edgemont Highlands Pass
- 767 Red Canyon Trail
- 1091 Red Canyon Trail
- 102 Red Canyon Trail
- 24 Engine Creek Ct
- 19 Terra Blue Way
- 20 Hay Barn Rd
- 36 Hay Barn Rd
- 163 Boulder View Dr
- 40 Edgemont Meadows Rd
- 123 Boulder View Dr
- 569 Edgemont Meadows Rd
- 82 Edgemont Meadows Rd
- 671 Edgemont Meadows Rd
- 154 Farm Pond Ln
- 192 Cabin Creek Dr
- 26 Boulder View Dr
- 140 Cabin Creek Dr
- 159 Novai Way
- 290 Copper Rim Trail
- 250 Copper Rim Trail
- 295 Copper Rim Trail
- 240 Copper Rim Trail
- 245 Copper Rim Trail
- 212d Copper Rim Trail
- 310 Copper Rim Trail
- 235 Copper Rim Trail
- 320 Copper Rim Trail
- 212 Copper Rim Trail Unit D
- 212 Copper Rim Trail Unit C
- 212 Copper Rim Trail Unit B
- 212 Copper Rim Trail Unit A
- 25 Red Table Ct
- 15 Red Table Ct
- 212 B Copper Rim
- 212 C Copper Rim
- 181 Copper Rim Trail
- 181 Copper Rim Trail
- 0 Copper Rim Trail Unit 769004