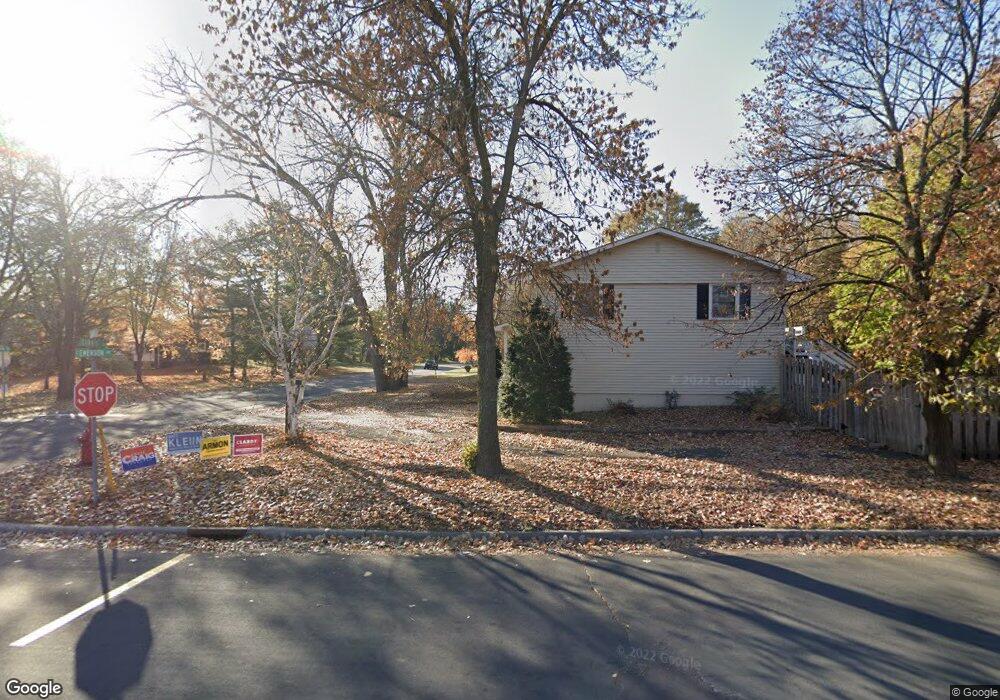
290 Emerson Ave W Saint Paul, MN 55118
Estimated Value: $295,000 - $342,000
3
Beds
1
Bath
1,040
Sq Ft
$304/Sq Ft
Est. Value
About This Home
This home is located at 290 Emerson Ave W, Saint Paul, MN 55118 and is currently estimated at $316,570, approximately $304 per square foot. 290 Emerson Ave W is a home located in Dakota County with nearby schools including Garlough Environmental Magnet, Heritage E-STEM Magnet School, and Two Rivers High School.
Ownership History
Date
Name
Owned For
Owner Type
Purchase Details
Closed on
Aug 28, 2014
Sold by
Quinian Andy and Quinian Tricia
Bought by
Pierce Jeffrey R and Nielsen Pierce Apolonia
Current Estimated Value
Home Financials for this Owner
Home Financials are based on the most recent Mortgage that was taken out on this home.
Original Mortgage
$157,399
Outstanding Balance
$119,828
Interest Rate
3.99%
Mortgage Type
FHA
Estimated Equity
$196,742
Purchase Details
Closed on
Sep 10, 2009
Sold by
The Bank Of Ny Mellon
Bought by
Quinlan Andrew D
Purchase Details
Closed on
Mar 22, 2000
Sold by
Ennis Ronald M and Ennis Shirley A
Bought by
Olmstead Cheryl A
Create a Home Valuation Report for This Property
The Home Valuation Report is an in-depth analysis detailing your home's value as well as a comparison with similar homes in the area
Home Values in the Area
Average Home Value in this Area
Purchase History
| Date | Buyer | Sale Price | Title Company |
|---|---|---|---|
| Pierce Jeffrey R | $171,900 | Title Recording Services | |
| Quinlan Andrew D | $142,900 | -- | |
| Olmstead Cheryl A | $130,000 | -- |
Source: Public Records
Mortgage History
| Date | Status | Borrower | Loan Amount |
|---|---|---|---|
| Open | Pierce Jeffrey R | $157,399 |
Source: Public Records
Tax History Compared to Growth
Tax History
| Year | Tax Paid | Tax Assessment Tax Assessment Total Assessment is a certain percentage of the fair market value that is determined by local assessors to be the total taxable value of land and additions on the property. | Land | Improvement |
|---|---|---|---|---|
| 2024 | $3,268 | $271,600 | $75,000 | $196,600 |
| 2023 | $3,268 | $274,500 | $79,500 | $195,000 |
| 2022 | $2,898 | $255,300 | $79,200 | $176,100 |
| 2021 | $2,762 | $234,000 | $68,800 | $165,200 |
| 2020 | $2,596 | $222,900 | $65,600 | $157,300 |
| 2019 | $2,430 | $205,900 | $62,400 | $143,500 |
| 2018 | $2,194 | $186,500 | $58,400 | $128,100 |
| 2017 | $2,107 | $177,400 | $55,600 | $121,800 |
| 2016 | $1,931 | $165,400 | $50,600 | $114,800 |
| 2015 | $1,748 | $130,729 | $42,078 | $88,651 |
| 2014 | -- | $114,052 | $36,319 | $77,733 |
| 2013 | -- | $105,877 | $32,900 | $72,977 |
Source: Public Records
Map
Nearby Homes
- 280 Edith Dr
- 69 Langer Cir
- 63 Langer Cir
- 389 Edith Dr
- 1384 Smith Ave S
- 1513 Smith Ave S
- 158 Southwind Ln
- 1450 Bidwell St Unit 110
- 111 Imperial Dr W Unit 102
- 100 Imperial Dr W Unit 204
- 1620 Charlton St Unit 109
- 170 Wentworth Ave W Unit F
- 242 Butler Ave W
- 1277 Hall Ave
- 180 Wentworth Ave W Unit E
- 8 Dorset Rd
- 1220 Stryker Ave
- 1062 Ohio St
- 1164 Dodd Rd
- 1095 Cherokee Ave
- 290 Emerson Ave W
- 286 Emerson Ave W
- 296 Emerson Ave W
- 290 290 Emerson-Avenue-w
- 280 Emerson Ave W
- 300 Emerson Ave W
- 291 Ruby Dr
- 276 Emerson Ave W
- 306 Emerson Ave W
- 301 Ruby Dr
- 283 Ruby Dr
- 293 Emerson Ave W
- 279 Emerson Ave W
- 299 Emerson Ave W
- 305 Ruby Dr
- 270 Emerson Ave W
- 312 Emerson Ave W
- 1344 1344 Ohio St
- 1344 1344 Ohio-Street-
- 273 Emerson Ave W