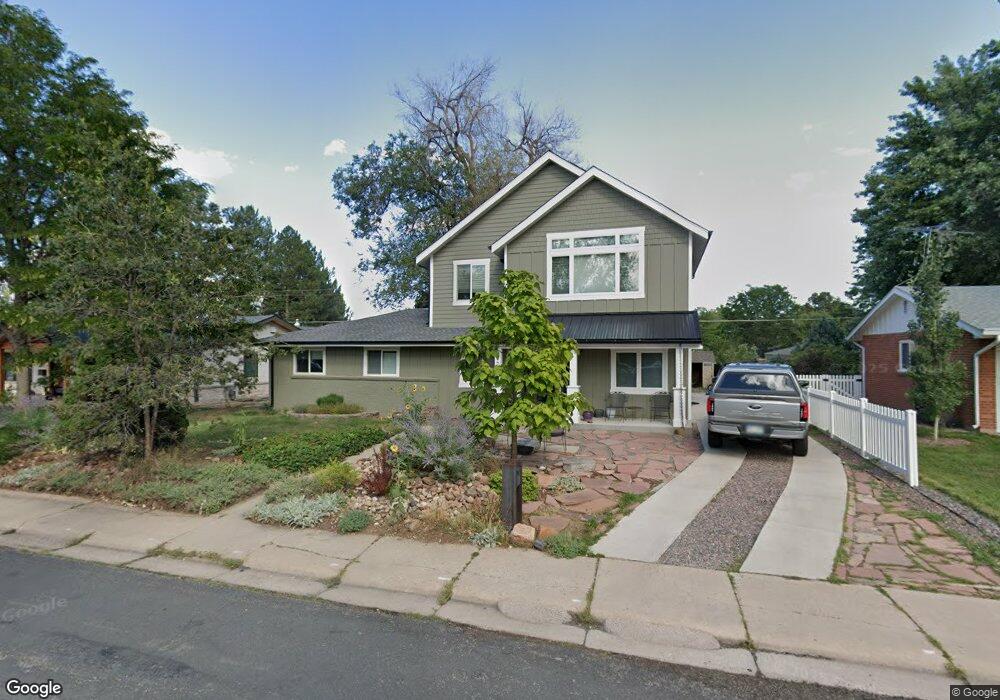
290 Martin Dr Boulder, CO 80305
South Boulder NeighborhoodEstimated Value: $754,000 - $1,174,015
3
Beds
1
Bath
1,040
Sq Ft
$1,016/Sq Ft
Est. Value
About This Home
This home is located at 290 Martin Dr, Boulder, CO 80305 and is currently estimated at $1,056,504, approximately $1,015 per square foot. 290 Martin Dr is a home located in Boulder County with nearby schools including Creekside Elementary School, Manhattan Middle School of the Arts & Academics, and Fairview High School.
Ownership History
Date
Name
Owned For
Owner Type
Purchase Details
Closed on
Jul 29, 2020
Sold by
Johnson John E and Johnson David Samuel
Bought by
Johnson John E
Current Estimated Value
Purchase Details
Closed on
Feb 10, 2012
Sold by
Johnson John E and Johnson Jessica M
Bought by
Johnson John E
Home Financials for this Owner
Home Financials are based on the most recent Mortgage that was taken out on this home.
Original Mortgage
$314,589
Outstanding Balance
$214,074
Interest Rate
3.75%
Mortgage Type
FHA
Estimated Equity
$842,430
Purchase Details
Closed on
Jul 28, 2010
Sold by
Johnson John E
Bought by
Johnson John E
Home Financials for this Owner
Home Financials are based on the most recent Mortgage that was taken out on this home.
Original Mortgage
$312,000
Interest Rate
4.54%
Mortgage Type
New Conventional
Purchase Details
Closed on
Aug 3, 2004
Sold by
Meyer Edna J
Bought by
Johnson John E
Home Financials for this Owner
Home Financials are based on the most recent Mortgage that was taken out on this home.
Original Mortgage
$226,400
Interest Rate
5.62%
Mortgage Type
Purchase Money Mortgage
Purchase Details
Closed on
Mar 22, 1978
Bought by
Johnson John E and Johnson David Samuel
Purchase Details
Closed on
Apr 25, 1974
Bought by
Johnson John E and Johnson David Samuel
Create a Home Valuation Report for This Property
The Home Valuation Report is an in-depth analysis detailing your home's value as well as a comparison with similar homes in the area
Home Values in the Area
Average Home Value in this Area
Purchase History
| Date | Buyer | Sale Price | Title Company |
|---|---|---|---|
| Johnson John E | -- | None Available | |
| Johnson John E | -- | Ct | |
| Johnson John E | -- | Ct | |
| Johnson John E | $283,000 | Guardian Title Agency Llc | |
| Johnson John E | -- | -- | |
| Johnson John E | $28,300 | -- |
Source: Public Records
Mortgage History
| Date | Status | Borrower | Loan Amount |
|---|---|---|---|
| Open | Johnson John E | $314,589 | |
| Closed | Johnson John E | $312,000 | |
| Closed | Johnson John E | $226,400 | |
| Closed | Johnson John E | $56,600 |
Source: Public Records
Tax History
| Year | Tax Paid | Tax Assessment Tax Assessment Total Assessment is a certain percentage of the fair market value that is determined by local assessors to be the total taxable value of land and additions on the property. | Land | Improvement |
|---|---|---|---|---|
| 2025 | $6,791 | $71,250 | $35,269 | $35,981 |
| 2024 | $6,791 | $71,250 | $35,269 | $35,981 |
| 2023 | $6,673 | $77,271 | $41,332 | $39,624 |
| 2022 | $5,890 | $63,425 | $30,656 | $32,769 |
| 2021 | $5,616 | $65,251 | $31,539 | $33,712 |
| 2020 | $5,235 | $60,146 | $25,740 | $34,406 |
| 2019 | $5,155 | $60,146 | $25,740 | $34,406 |
| 2018 | $3,308 | $38,153 | $23,688 | $14,465 |
| 2017 | $3,204 | $42,180 | $26,188 | $15,992 |
| 2016 | $3,003 | $34,689 | $16,477 | $18,212 |
| 2015 | $2,844 | $28,409 | $14,567 | $13,842 |
| 2014 | $2,389 | $28,409 | $14,567 | $13,842 |
Source: Public Records
Map
Nearby Homes
- 3000 Dartmouth Ave
- 3805 Martin Dr
- 210 S 39th St
- 345 S 38th St
- 780 33rd St
- 805 29th St Unit 253
- 805 29th St Unit 157
- 805 29th St Unit 402
- 805 29th St Unit 404
- 2955 Stanford Ave
- 2585 Kohler Dr
- 2850 Aurora Ave Unit 107
- 245 Fair Place
- 2221 Columbine Ave
- 810 37th St
- 2800 Aurora Ave Unit 119
- 450 S 41st St
- 905 36th St
- 2141 Baseline Rd Unit 18
- 2032 Mariposa Ave
Your Personal Tour Guide
Ask me questions while you tour the home.