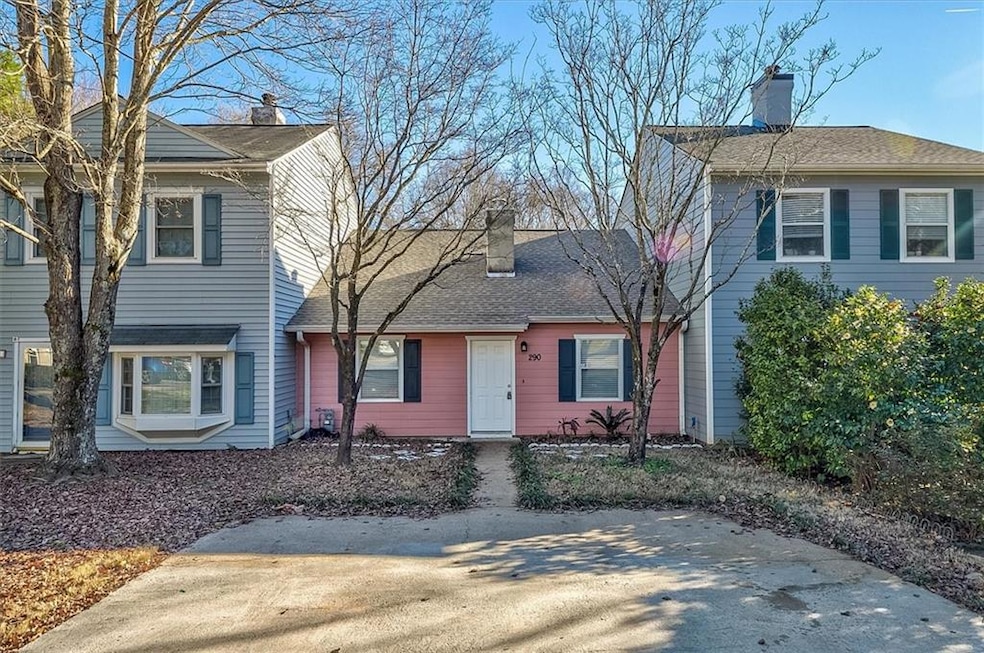
290 Westland Way SW Marietta, GA 30064
Southwestern Marietta NeighborhoodEstimated payment $1,402/month
Highlights
- Very Popular Property
- Deck
- Stone Countertops
- A.L. Burruss Elementary School Rated 9+
- Traditional Architecture
- Breakfast Room
About This Home
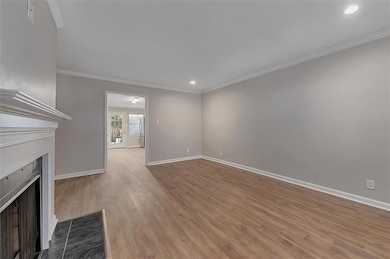
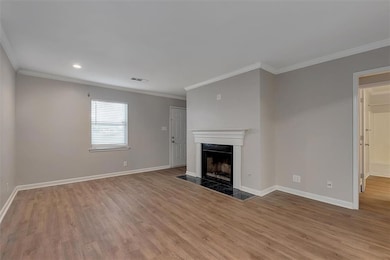
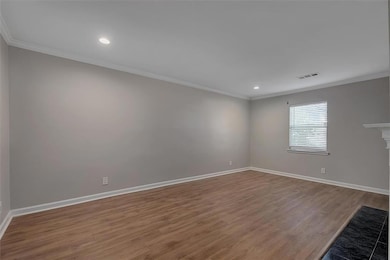
Welcome to this beautifully renovated single-level townhouse, perfectly situated on a quiet cul-de-sac just minutes from vibrant downtown Marietta. This charming home features a desirable master-on-main layout and has been thoughtfully updated throughout to offer modern comfort and style.
Step inside to vinyl flooring, paint, and upgraded lighting that creates a bright and welcoming ambiance. The fully renovated kitchen boasts white shaker cabinets, stainless steel appliances, and granite countertops — an ideal space for cooking and entertaining. Enjoy outdoor living in the private, fenced-in backyard complete with an attached storage closet — perfect for tools, bikes, or seasonal items. Whether you’re relaxing at home or heading into the nearby downtown area for shopping, dining, and local events, this location offers true convenience and lifestyle appeal. Move-in ready and beautifully finished, this Marietta gem won’t last long!
Townhouse Details
Home Type
- Townhome
Est. Annual Taxes
- $778
Year Built
- Built in 1983
Lot Details
- 2,492 Sq Ft Lot
- Two or More Common Walls
- Cul-De-Sac
- Back Yard Fenced
Home Design
- Traditional Architecture
- Slab Foundation
- Composition Roof
- HardiePlank Type
Interior Spaces
- 1,064 Sq Ft Home
- 1-Story Property
- Ceiling Fan
- Double Pane Windows
- Entrance Foyer
- Family Room with Fireplace
- Breakfast Room
- Luxury Vinyl Tile Flooring
- Laundry on main level
Kitchen
- Open to Family Room
- Electric Oven
- Electric Range
- Microwave
- Dishwasher
- Stone Countertops
- White Kitchen Cabinets
Bedrooms and Bathrooms
- 2 Main Level Bedrooms
- 2 Full Bathrooms
- Bathtub and Shower Combination in Primary Bathroom
Home Security
Parking
- 2 Parking Spaces
- Driveway
Outdoor Features
- Deck
- Outdoor Storage
Schools
- A.L. Burruss Elementary School
- Marietta Middle School
- Marietta High School
Utilities
- Central Heating and Cooling System
- 220 Volts
- Cable TV Available
Listing and Financial Details
- Assessor Parcel Number 16122501290
Community Details
Overview
- Westland Subdivision
- FHA/VA Approved Complex
Security
- Carbon Monoxide Detectors
- Fire and Smoke Detector
Map
Home Values in the Area
Average Home Value in this Area
Tax History
| Year | Tax Paid | Tax Assessment Tax Assessment Total Assessment is a certain percentage of the fair market value that is determined by local assessors to be the total taxable value of land and additions on the property. | Land | Improvement |
|---|---|---|---|---|
| 2025 | $778 | $92,012 | $34,000 | $58,012 |
| 2024 | $778 | $92,012 | $34,000 | $58,012 |
| 2023 | $460 | $54,400 | $18,440 | $35,960 |
| 2022 | $460 | $54,400 | $18,440 | $35,960 |
| 2021 | $401 | $46,712 | $20,000 | $26,712 |
| 2020 | $298 | $34,712 | $8,000 | $26,712 |
| 2019 | $298 | $34,712 | $8,000 | $26,712 |
| 2018 | $260 | $30,224 | $8,000 | $22,224 |
| 2017 | $194 | $28,224 | $6,000 | $22,224 |
| 2016 | $144 | $20,844 | $4,000 | $16,844 |
| 2015 | $156 | $20,844 | $4,000 | $16,844 |
| 2014 | $162 | $20,844 | $0 | $0 |
Property History
| Date | Event | Price | List to Sale | Price per Sq Ft |
|---|---|---|---|---|
| 12/03/2025 12/03/25 | For Sale | $255,000 | 0.0% | $240 / Sq Ft |
| 11/12/2025 11/12/25 | For Rent | $1,750 | -- | -- |
Purchase History
| Date | Type | Sale Price | Title Company |
|---|---|---|---|
| Special Warranty Deed | -- | None Listed On Document | |
| Special Warranty Deed | -- | None Listed On Document | |
| Limited Warranty Deed | $136,000 | None Available | |
| Warranty Deed | -- | -- | |
| Quit Claim Deed | -- | None Available | |
| Warranty Deed | -- | -- | |
| Warranty Deed | -- | -- | |
| Quit Claim Deed | -- | None Available | |
| Deed | $44,500 | -- |
Mortgage History
| Date | Status | Loan Amount | Loan Type |
|---|---|---|---|
| Previous Owner | $125,000 | Purchase Money Mortgage | |
| Closed | $0 | No Value Available |
Source: First Multiple Listing Service (FMLS)
MLS Number: 7688286
APN: 16-1225-0-129-0
Disclaimer: Certain information contained herein is derived from information provided by parties other than Homes.com. All information provided is deemed reliable, but is not guaranteed to be accurate and should be independently verified.
![]() Listings identified with the FMLS IDX logo come from FMLS and are held by brokerage firms other than the owner of this website. The listing brokerage is identified in any listing details. Information is deemed reliable but is not guaranteed. If you believe any FMLS listing contains material that infringes your copyrighted work please visit www.fmls.com/dmca to review our DMCA policy and learn how to submit a takedown request. © 2025 First Multiple Listing Service, Inc.
Listings identified with the FMLS IDX logo come from FMLS and are held by brokerage firms other than the owner of this website. The listing brokerage is identified in any listing details. Information is deemed reliable but is not guaranteed. If you believe any FMLS listing contains material that infringes your copyrighted work please visit www.fmls.com/dmca to review our DMCA policy and learn how to submit a takedown request. © 2025 First Multiple Listing Service, Inc.
- 1141 Whitlock Ave NW
- 818 Manning Way SW Unit 1
- 260 Manning Rd SW Unit 110
- 805 Manning Way SW
- 594 Manning Rd SW
- 560 Manning Rd SW
- 1077 New Haven Dr SW Unit 12A
- 917 Wemberley Ln
- 798 Sentinel Ridge SW
- 909 Wemberley Ln
- 984 Wemberley Ln
- 927 Burnt Hickory Cir NW Unit 10
- 920 Wemberley Ln
- 873 Cavalry Dr SW
- 945 Burnt Hickory Cir NW Unit 8
- 834 Cannon Run SW
- 574 Manning Rd SW
- 1001 Burnt Hickory Rd NW
- 15 Carriage Oaks Dr NW
- 516 Faith St NW
- 340 Hermitage Ct SW
- 360 Maple Ave NW
- 313 Cabaret Ct SW
- 286 Toweridge Dr SW
- 438 Bannon Way
- 445 N Sessions St NW Unit 1207
- 175 Booth Rd SW
- 825 Powder Springs St
- 111 N Marietta Pkwy NE
- 579 Nancy St NW
- 179 Mt Calvary Rd
- 18 Garrison Rd SE
- 1250 Powder Springs St
- 150 Hedges St SE
- 1172 Cayman Ln SW
- 294 E Burns Ct SW Unit D
