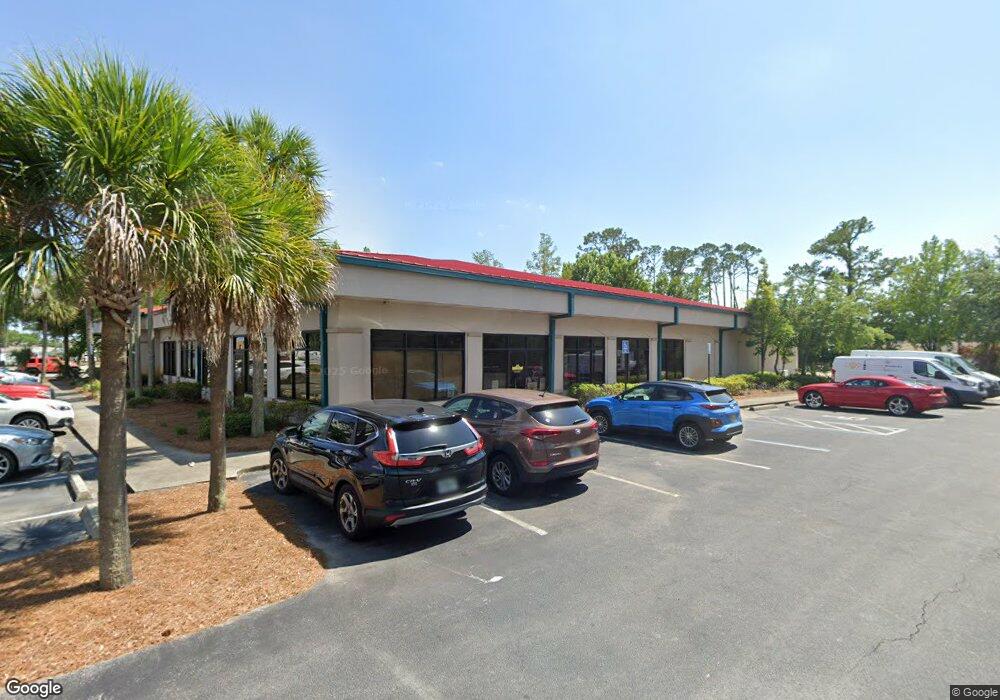
2900 Thomas Dr Unit Suite B & C Panama City, FL 32408
Estimated Value: $2,553,654
--
Bed
--
Bath
4,428
Sq Ft
$577/Sq Ft
Est. Value
About This Home
This home is located at 2900 Thomas Dr Unit Suite B & C, Panama City, FL 32408 and is currently estimated at $2,553,654, approximately $576 per square foot. 2900 Thomas Dr Unit Suite B & C is a home located in Bay County with nearby schools including J.R. Arnold High School, Surfside Middle School, and Patronis Elementary School.
Ownership History
Date
Name
Owned For
Owner Type
Purchase Details
Closed on
May 30, 2023
Sold by
Hooks Heney
Bought by
Butchikas Constantine and Butchikas Patti
Current Estimated Value
Purchase Details
Closed on
May 24, 2023
Sold by
Marsh Bettye Sue
Bought by
Lee Curtis Doyle and Lee Gina Kay
Purchase Details
Closed on
May 18, 2022
Sold by
Olwfred Llc
Bought by
Park Trammel Brittle Revocable Trust and Brittle
Home Financials for this Owner
Home Financials are based on the most recent Mortgage that was taken out on this home.
Original Mortgage
$800,000
Interest Rate
4.72%
Mortgage Type
Seller Take Back
Purchase Details
Closed on
Oct 16, 2019
Sold by
Nancy Lp
Bought by
Olwfred Llc
Home Financials for this Owner
Home Financials are based on the most recent Mortgage that was taken out on this home.
Original Mortgage
$1,508,750
Interest Rate
3.4%
Mortgage Type
Commercial
Create a Home Valuation Report for This Property
The Home Valuation Report is an in-depth analysis detailing your home's value as well as a comparison with similar homes in the area
Home Values in the Area
Average Home Value in this Area
Purchase History
| Date | Buyer | Sale Price | Title Company |
|---|---|---|---|
| Butchikas Constantine | $10,000 | None Listed On Document | |
| Lee Curtis Doyle | $100 | None Listed On Document | |
| Park Trammel Brittle Revocable Trust | $2,800,000 | New Title Company Name | |
| Olwfred Llc | $1,775,000 | South Oak Ttl Panama City Be |
Source: Public Records
Mortgage History
| Date | Status | Borrower | Loan Amount |
|---|---|---|---|
| Previous Owner | Park Trammel Brittle Revocable Trust | $800,000 | |
| Previous Owner | Olwfred Llc | $1,508,750 |
Source: Public Records
Tax History Compared to Growth
Tax History
| Year | Tax Paid | Tax Assessment Tax Assessment Total Assessment is a certain percentage of the fair market value that is determined by local assessors to be the total taxable value of land and additions on the property. | Land | Improvement |
|---|---|---|---|---|
| 2024 | $26,580 | $2,094,811 | $631,620 | $1,463,191 |
| 2023 | $26,580 | $2,109,964 | $631,620 | $1,478,344 |
| 2022 | $19,485 | $1,667,374 | $521,086 | $1,146,288 |
| 2021 | $18,715 | $1,543,852 | $385,990 | $1,157,862 |
| 2020 | $19,122 | $1,555,425 | $385,990 | $1,169,435 |
| 2019 | $12,287 | $981,077 | $350,900 | $630,177 |
| 2018 | $12,414 | $975,768 | $0 | $0 |
| 2017 | $12,709 | $992,616 | $0 | $0 |
| 2016 | $12,996 | $996,819 | $0 | $0 |
| 2015 | $13,425 | $1,002,067 | $0 | $0 |
| 2014 | $13,630 | $1,018,914 | $0 | $0 |
Source: Public Records
Map
Nearby Homes
- 6212 N Lagoon Dr
- 468 Wahoo Rd
- 6320 N Lagoon Dr
- 2616 Redwood St
- 2619 Beech St
- 6720 Broward St
- 1507 Trout Ln
- 6401 N Lagoon Dr
- 1413 Trout Dr
- 1502 Trout Ln
- 5901 Magnolia Beach Rd
- 5701 S Lagoon Dr
- 3532 Treasure Cir
- 3707 Mystic St Unit A & B
- 3707 Mystic St A-B Unit A & B
- 497 Wahoo Rd
- 3530 Treasure Cir
- 5434 Hopetown Ln
- 2334 Beech St
- 6308 Causeway Rd
- 2900 Thomas Dr Unit 2908
- 2900 Thomas Dr Unit ''A''
- 2900 Thomas Dr
- 2900 Thomas Dr Unit 1
- 2902 Thomas Dr
- 6202 N Lagoon Dr
- 6204 N Lagoon Dr
- 6206 N Lagoon Dr
- 2920 Thomas Dr
- 6208 N Lagoon Dr
- 6135 N Lagoon Dr Unit 204
- 6135 N Lagoon Dr Unit 203
- 6135 N Lagoon Dr Unit 202
- 6135 N Lagoon Dr Unit 201
- 6135 N Lagoon Dr Unit 101
- 6135 N Lagoon Dr Unit 302
- 6135 N Lagoon Dr Unit 103
- 6135 N Lagoon Dr Unit 303
- 6135 N Lagoon Dr Unit 304
- 6135 N Lagoon Dr Unit 301