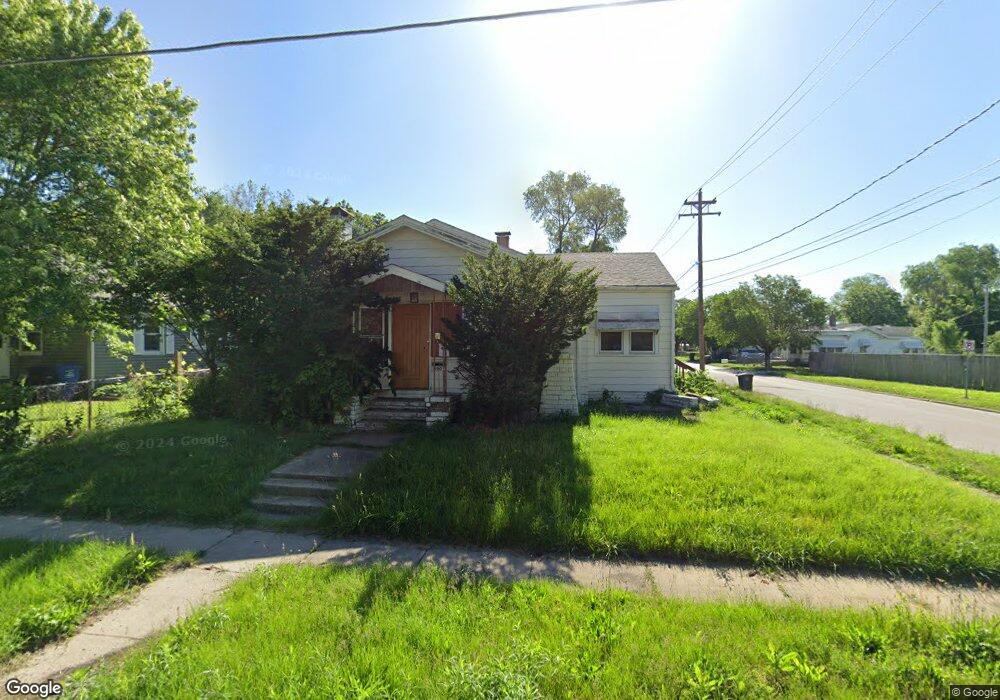
2901 5th Ave Des Moines, IA 50313
Highland Park NeighborhoodEstimated Value: $164,000 - $183,000
3
Beds
1
Bath
1,368
Sq Ft
$126/Sq Ft
Est. Value
About This Home
This home is located at 2901 5th Ave, Des Moines, IA 50313 and is currently estimated at $172,234, approximately $125 per square foot. 2901 5th Ave is a home located in Polk County with nearby schools including Oak Park Elementary School, Harding Middle School, and North High School.
Ownership History
Date
Name
Owned For
Owner Type
Purchase Details
Closed on
Nov 4, 2024
Sold by
Phan Tuong
Bought by
Ho Hoa
Current Estimated Value
Purchase Details
Closed on
Mar 9, 2007
Sold by
Phan Michelle and Phan Duyen
Bought by
Phan Tuong and Ho Hoa
Home Financials for this Owner
Home Financials are based on the most recent Mortgage that was taken out on this home.
Original Mortgage
$73,841
Interest Rate
6.4%
Mortgage Type
Stand Alone Refi Refinance Of Original Loan
Purchase Details
Closed on
Feb 23, 2004
Sold by
Phan Tri Tu and Tran Mui Pho
Bought by
Phan Michelle and Phan Duyen
Purchase Details
Closed on
Jan 16, 1997
Sold by
Townes Elizabeth and Walker Carolyn
Bought by
Phan Tri Tu and Tran Pho Mui
Home Financials for this Owner
Home Financials are based on the most recent Mortgage that was taken out on this home.
Original Mortgage
$38,400
Interest Rate
7.13%
Create a Home Valuation Report for This Property
The Home Valuation Report is an in-depth analysis detailing your home's value as well as a comparison with similar homes in the area
Home Values in the Area
Average Home Value in this Area
Purchase History
| Date | Buyer | Sale Price | Title Company |
|---|---|---|---|
| Ho Hoa | -- | None Listed On Document | |
| Phan Tuong | $75,500 | Itc | |
| Phan Michelle | -- | -- | |
| Phan Tri Tu | $47,500 | -- |
Source: Public Records
Mortgage History
| Date | Status | Borrower | Loan Amount |
|---|---|---|---|
| Previous Owner | Phan Tuong | $73,841 | |
| Previous Owner | Phan Tri Tu | $38,400 |
Source: Public Records
Tax History Compared to Growth
Tax History
| Year | Tax Paid | Tax Assessment Tax Assessment Total Assessment is a certain percentage of the fair market value that is determined by local assessors to be the total taxable value of land and additions on the property. | Land | Improvement |
|---|---|---|---|---|
| 2025 | $2,786 | $164,600 | $18,400 | $146,200 |
| 2024 | $2,786 | $141,600 | $15,800 | $125,800 |
| 2023 | $2,788 | $141,600 | $15,800 | $125,800 |
| 2022 | $2,766 | $118,300 | $13,700 | $104,600 |
| 2021 | $2,566 | $118,300 | $13,700 | $104,600 |
| 2020 | $2,666 | $102,800 | $12,000 | $90,800 |
| 2019 | $2,430 | $102,800 | $12,000 | $90,800 |
| 2018 | $2,404 | $90,400 | $10,400 | $80,000 |
| 2017 | $2,408 | $90,400 | $10,400 | $80,000 |
| 2016 | $2,346 | $89,000 | $10,200 | $78,800 |
| 2015 | $2,346 | $89,000 | $10,200 | $78,800 |
| 2014 | $2,506 | $94,300 | $10,700 | $83,600 |
Source: Public Records
Map
Nearby Homes