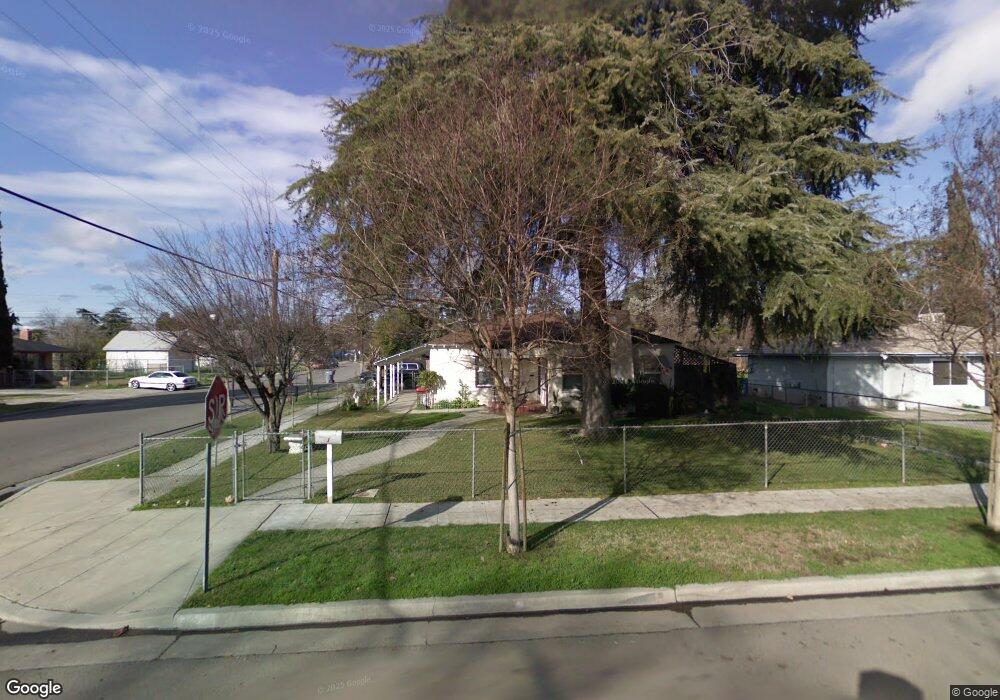
2901 E University Ave Fresno, CA 93703
McLane NeighborhoodEstimated Value: $258,461 - $293,000
2
Beds
1
Bath
1,356
Sq Ft
$206/Sq Ft
Est. Value
About This Home
This home is located at 2901 E University Ave, Fresno, CA 93703 and is currently estimated at $279,487, approximately $206 per square foot. 2901 E University Ave is a home located in Fresno County with nearby schools including Birney Elementary School, Scandinavian Middle School, and Mclane High School.
Ownership History
Date
Name
Owned For
Owner Type
Purchase Details
Closed on
Aug 24, 2006
Sold by
Martinez Rachel
Bought by
Martinez Louie and Martinez Rachel
Current Estimated Value
Home Financials for this Owner
Home Financials are based on the most recent Mortgage that was taken out on this home.
Original Mortgage
$92,300
Interest Rate
6.33%
Mortgage Type
New Conventional
Purchase Details
Closed on
Aug 15, 2006
Sold by
Martinez Louie
Bought by
Martinez Rachel
Home Financials for this Owner
Home Financials are based on the most recent Mortgage that was taken out on this home.
Original Mortgage
$92,300
Interest Rate
6.33%
Mortgage Type
New Conventional
Purchase Details
Closed on
Mar 29, 1995
Sold by
Algier Robert
Bought by
Martinez Louie and Martinez Rachel
Home Financials for this Owner
Home Financials are based on the most recent Mortgage that was taken out on this home.
Original Mortgage
$40,797
Interest Rate
8.32%
Mortgage Type
FHA
Create a Home Valuation Report for This Property
The Home Valuation Report is an in-depth analysis detailing your home's value as well as a comparison with similar homes in the area
Home Values in the Area
Average Home Value in this Area
Purchase History
| Date | Buyer | Sale Price | Title Company |
|---|---|---|---|
| Martinez Louie | -- | Alliance Title Company | |
| Martinez Rachel | -- | Alliance Title Company | |
| Martinez Louie | $40,000 | North American Title Company |
Source: Public Records
Mortgage History
| Date | Status | Borrower | Loan Amount |
|---|---|---|---|
| Closed | Martinez Rachel | $92,300 | |
| Previous Owner | Martinez Louie | $40,797 |
Source: Public Records
Tax History
| Year | Tax Paid | Tax Assessment Tax Assessment Total Assessment is a certain percentage of the fair market value that is determined by local assessors to be the total taxable value of land and additions on the property. | Land | Improvement |
|---|---|---|---|---|
| 2025 | $803 | $67,152 | $33,576 | $33,576 |
| 2023 | $772 | $64,546 | $32,273 | $32,273 |
| 2022 | $744 | $63,282 | $31,641 | $31,641 |
| 2021 | $722 | $62,042 | $31,021 | $31,021 |
| 2020 | $718 | $61,406 | $30,703 | $30,703 |
| 2019 | $689 | $60,202 | $30,101 | $30,101 |
| 2018 | $673 | $59,022 | $29,511 | $29,511 |
| 2017 | $660 | $57,866 | $28,933 | $28,933 |
| 2016 | $637 | $56,732 | $28,366 | $28,366 |
| 2015 | $626 | $55,880 | $27,940 | $27,940 |
| 2014 | $611 | $54,786 | $27,393 | $27,393 |
Source: Public Records
Map
Nearby Homes
- 2021 N Fresno St
- 3030 E Home Ave
- 2136 N First St
- 3335 E Normal Ave
- 3075 E Floradora Ave
- 3343 E Weldon Ave
- 2219 E Cambridge Ave
- 3115 E Clinton Ave
- 2414 N 1st St
- 1361 N First St
- 3039 E Hedges Ave
- 3442 E Weldon Ave
- 3435 E Mckinley Ave
- 2702 E Hedges Ave
- 3020 E Hedges Ave
- 3404 E Home Ave
- 2233 E Terrace Ave
- 3493 E Joyce Dr
- 2901 E Princeton Ave
- 2425 E Brown Ave
- 2913 E University Ave
- 2927 E University Ave
- 2904 E Normal Ave
- 1801 N Angus St
- 1819 N Angus St
- 1738 N Angus St
- 2935 E University Ave
- 2844 E Normal Ave
- 2934 E Normal Ave
- 1735 N Angus St
- 1728 N Angus St
- 2840 E Normal Ave
- 2932 E University Ave
- 2819 E University Ave Unit 101
- 2955 E University Ave
- 2836 E Normal Ave
- 2814 E Normal Ave
- 2905 E Normal Ave
- 2952 E University Ave
- 2954 E Normal Ave
Your Personal Tour Guide
Ask me questions while you tour the home.