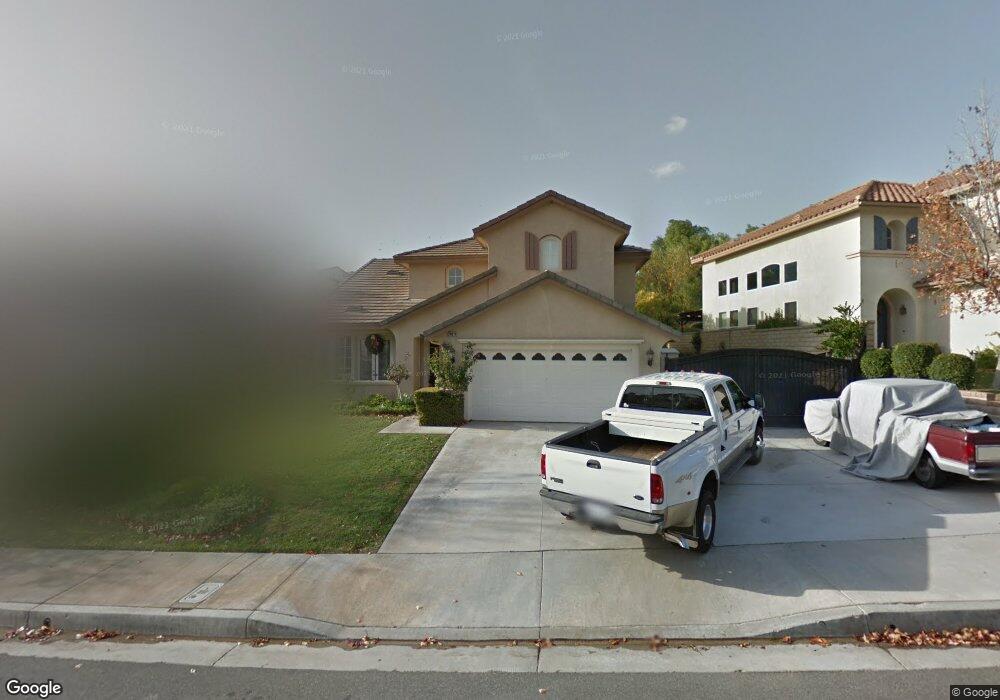
29019 Cedar Glen Ct Santa Clarita, CA 91390
Saugus NeighborhoodEstimated Value: $960,000 - $1,068,000
4
Beds
3
Baths
2,715
Sq Ft
$368/Sq Ft
Est. Value
About This Home
This home is located at 29019 Cedar Glen Ct, Santa Clarita, CA 91390 and is currently estimated at $998,079, approximately $367 per square foot. 29019 Cedar Glen Ct is a home located in Los Angeles County with nearby schools including Mountainview Elementary School, Rio Norte Junior High School, and Valencia High School.
Ownership History
Date
Name
Owned For
Owner Type
Purchase Details
Closed on
Apr 11, 2025
Sold by
Osler Cherie J
Bought by
Osler Trust and Osler
Current Estimated Value
Purchase Details
Closed on
Apr 22, 2020
Sold by
Osler Cherie J
Bought by
Osler Cherie J and The R S And C J Osler Trust Da
Home Financials for this Owner
Home Financials are based on the most recent Mortgage that was taken out on this home.
Original Mortgage
$449,000
Interest Rate
3.6%
Mortgage Type
New Conventional
Purchase Details
Closed on
Oct 16, 2002
Sold by
Osler Cherie J
Bought by
Osler Cherie J and R S & C J Osler Trust
Purchase Details
Closed on
Nov 20, 2000
Sold by
Pacific Bay Properties
Bought by
Osler Ralph S and Osler Cherie J
Home Financials for this Owner
Home Financials are based on the most recent Mortgage that was taken out on this home.
Original Mortgage
$126,000
Interest Rate
7.08%
Create a Home Valuation Report for This Property
The Home Valuation Report is an in-depth analysis detailing your home's value as well as a comparison with similar homes in the area
Home Values in the Area
Average Home Value in this Area
Purchase History
| Date | Buyer | Sale Price | Title Company |
|---|---|---|---|
| Osler Trust | -- | None Listed On Document | |
| Osler Cherie J | -- | None Listed On Document | |
| Osler Cherie J | -- | Fidelity National Title | |
| Osler Cherie J | -- | Fidelity National Title | |
| Osler Cherie J | -- | -- | |
| Osler Ralph S | $315,000 | Chicago Title Co |
Source: Public Records
Mortgage History
| Date | Status | Borrower | Loan Amount |
|---|---|---|---|
| Previous Owner | Osler Cherie J | $449,000 | |
| Previous Owner | Osler Ralph S | $126,000 |
Source: Public Records
Tax History Compared to Growth
Tax History
| Year | Tax Paid | Tax Assessment Tax Assessment Total Assessment is a certain percentage of the fair market value that is determined by local assessors to be the total taxable value of land and additions on the property. | Land | Improvement |
|---|---|---|---|---|
| 2025 | $7,437 | $507,002 | $181,262 | $325,740 |
| 2024 | $7,038 | $497,061 | $177,708 | $319,353 |
| 2023 | $6,755 | $487,316 | $174,224 | $313,092 |
| 2022 | $6,783 | $477,761 | $170,808 | $306,953 |
| 2021 | $6,662 | $468,394 | $167,459 | $300,935 |
| 2020 | $6,605 | $463,592 | $165,742 | $297,850 |
| 2019 | $6,438 | $454,503 | $162,493 | $292,010 |
| 2018 | $6,263 | $445,592 | $159,307 | $286,285 |
| 2016 | $5,904 | $428,291 | $153,122 | $275,169 |
| 2015 | $5,686 | $421,858 | $150,822 | $271,036 |
| 2014 | $5,597 | $413,595 | $147,868 | $265,727 |
Source: Public Records
Map
Nearby Homes
- 29027 Raintree Ln
- 29047 Ironwood Ln
- 22939 Raintree Ln
- 29160 Harmony Way
- 28724 Magnolia Way
- 22229 Evening Star Ct
- 28988 Rock Canyon Dr
- 28435 Seco Canyon Rd Unit 154
- 0 San Francisquito Canyon Unit SR25214323
- 28415 Seco Canyon Rd Unit 125
- 28345 Seco Canyon Rd Unit 97
- 28341 Seco Canyon Rd Unit 107
- 22911 Banyan Place
- 28774 San Francisquito Canyon Rd
- 22440 Skylake Place
- 28321 Evergreen Ln
- 22943 Banyan Place Unit 306
- 28241 Tamarack Ln
- 28123 Seco Canyon Rd Unit 94
- 28121 Seco Canyon Rd Unit 86
- 29011 Cedar Glen Ct
- 29027 Cedar Glen Ct
- 29018 Raintree Ln
- 29033 Cedar Glen Ct
- 29005 Cedar Glen Ct
- 29016 Cedar Glen Ct
- 29022 Cedar Glen Ct
- 29024 Raintree Ln
- 29039 Cedar Glen Ct
- 29028 Cedar Glen Ct
- 29006 Cedar Glen Ct
- 29032 Cedar Glen Ct
- 29012 Cedar Glen Ct
- 29002 Cedar Glen Ct
- 29028 Raintree Ln
- 29045 Cedar Glen Ct
- 29038 Cedar Glen Ct
- 29013 Raintree Ln
- 29003 Raintree Ln
- 29044 Cedar Glen Ct