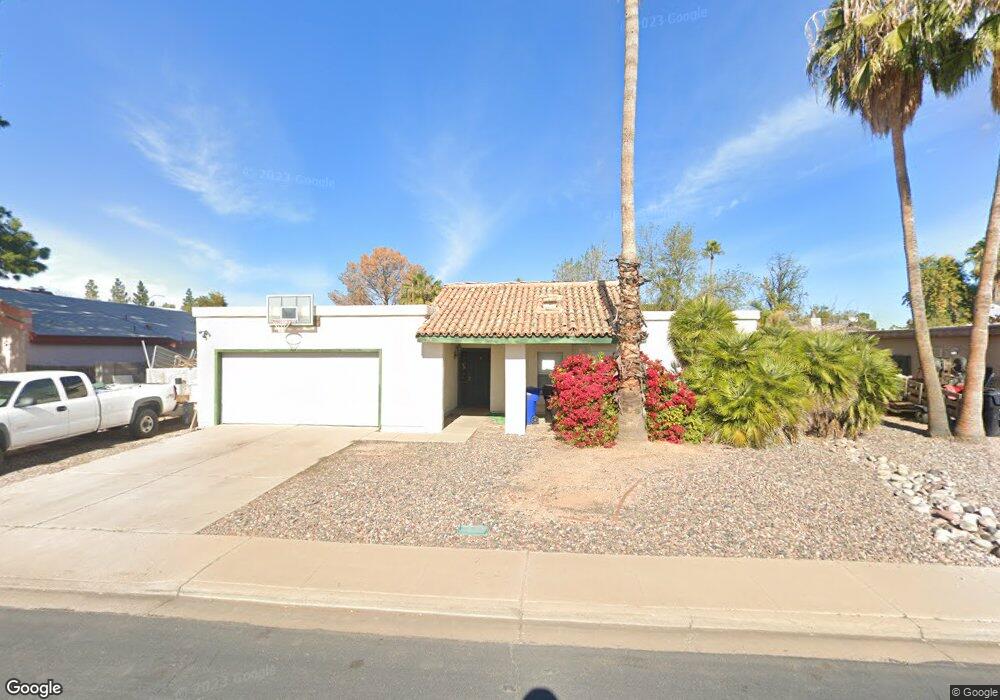
2904 E Coralbell Ave Mesa, AZ 85204
Central Mesa NeighborhoodEstimated Value: $375,358 - $477,000
Studio
2
Baths
1,636
Sq Ft
$262/Sq Ft
Est. Value
About This Home
This home is located at 2904 E Coralbell Ave, Mesa, AZ 85204 and is currently estimated at $428,340, approximately $261 per square foot. 2904 E Coralbell Ave is a home located in Maricopa County with nearby schools including Irving Elementary School, Franklin at Brimhall Elementary School, and Franklin West Elementary School.
Ownership History
Date
Name
Owned For
Owner Type
Purchase Details
Closed on
Jun 18, 2001
Sold by
Offerson Shellee Lee
Bought by
Offerson Jeremiah James and Offerson Shellee Lee
Current Estimated Value
Home Financials for this Owner
Home Financials are based on the most recent Mortgage that was taken out on this home.
Original Mortgage
$20,000
Interest Rate
7.13%
Purchase Details
Closed on
Sep 27, 1999
Sold by
Offerson Jeremiah James
Bought by
Offerson Shellee Lee
Purchase Details
Closed on
Sep 24, 1999
Sold by
Wong Robert Tak
Bought by
Offerson Shellee L
Create a Home Valuation Report for This Property
The Home Valuation Report is an in-depth analysis detailing your home's value as well as a comparison with similar homes in the area
Home Values in the Area
Average Home Value in this Area
Purchase History
| Date | Buyer | Sale Price | Title Company |
|---|---|---|---|
| Offerson Jeremiah James | -- | -- | |
| Offerson Shellee Lee | -- | Security Title Agency | |
| Offerson Shellee L | $115,000 | Security Title Agency |
Source: Public Records
Mortgage History
| Date | Status | Borrower | Loan Amount |
|---|---|---|---|
| Closed | Offerson Jeremiah James | $20,000 |
Source: Public Records
Tax History
| Year | Tax Paid | Tax Assessment Tax Assessment Total Assessment is a certain percentage of the fair market value that is determined by local assessors to be the total taxable value of land and additions on the property. | Land | Improvement |
|---|---|---|---|---|
| 2025 | $1,593 | $16,142 | -- | -- |
| 2024 | $1,597 | $15,374 | -- | -- |
| 2023 | $1,597 | $31,380 | $6,270 | $25,110 |
| 2022 | $1,564 | $23,970 | $4,790 | $19,180 |
| 2021 | $1,583 | $22,980 | $4,590 | $18,390 |
| 2020 | $1,563 | $21,170 | $4,230 | $16,940 |
| 2019 | $1,460 | $19,130 | $3,820 | $15,310 |
| 2018 | $1,401 | $17,730 | $3,540 | $14,190 |
| 2017 | $1,360 | $16,080 | $3,210 | $12,870 |
| 2016 | $1,334 | $15,600 | $3,120 | $12,480 |
| 2015 | $1,254 | $14,510 | $2,900 | $11,610 |
Source: Public Records
Map
Nearby Homes
- 2929 E Broadway Rd Unit 67
- 2737 E Catalina Ave
- 3104 E Broadway Rd Unit 230
- 3104 E Broadway Rd Unit 304
- 3104 E Broadway Rd Unit 203
- 3104 E Broadway Rd Unit 271
- 3104 E Broadway Rd Unit 293
- 3104 E Broadway Rd Unit 276
- 3104 E Broadway Rd Unit 307
- 3104 E Broadway Rd Unit 184
- 3104 E Broadway Rd Unit 272
- 546 S 26th St
- 522 S 26th St
- 628 S 26th St
- 2554 E Catalina Ave
- 349 S Wayfarer
- 2929 E Main St Unit 219
- 2929 E Main St Unit 48
- 2929 E Main St Unit 43
- 2929 E Main St Unit 269
- 2864 E Coralbell Ave
- 2910 E Coralbell Ave
- 2903 E Concho Ave
- 2911 E Concho Ave
- 2861 E Concho Ave
- 2856 E Coralbell Ave
- 2901 E Coralbell Ave
- 2916 E Coralbell Ave
- 2909 E Coralbell Ave
- 2863 E Coralbell Ave
- 2917 E Concho Ave
- 2857 E Concho Ave
- 2913 E Coralbell Ave
- 2855 E Coralbell Ave Unit 2
- 2844 E Coralbell Ave
- 2920 E Coralbell Ave
- 2902 E Concho Ave
- 2845 E Concho Ave
- 2908 E Concho Ave Unit 2
- 2721 E Concho Ave
Your Personal Tour Guide
Ask me questions while you tour the home.