NOT LISTED FOR SALE

Estimated Value: $210,870

-- Bed
-- Bath
2,364 Sq Ft
$89/Sq Ft Est. Value

Last Sold April 15, 2015

Last sale price $140,000 $59 Per Sq Ft

Est. 51% increase in value since last sale

Current estimated payment $1,386/month

70 Days on Market

About This Home

As of April 2015

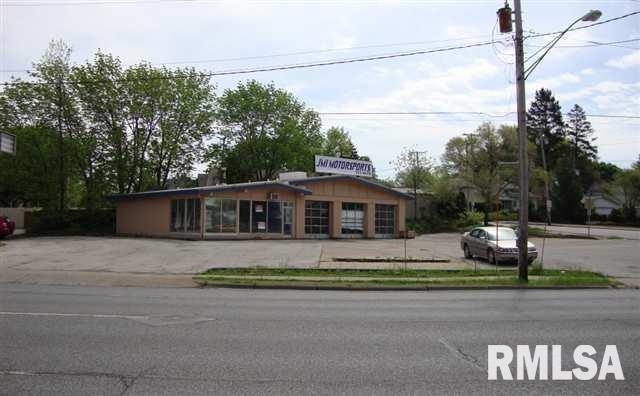
2,364 SF Building on high traffic corner lot with excellent visibility along Brady Street (Hwy 61). Building includes 3 overhead doors and large store front display window. Located in Central Davenport with easy assess to all major roadways. Ample Parking.

Last Agent to Sell the Property

Thad DenHartog

Mel Foster Co. Commercial License #B39654000/471.002649 Listed on: 01/08/2015

Mel Foster Co. Commercial

Last Buyer's Agent

Thad DenHartog

Mel Foster Co. Commercial License #B39654000/471.002649 Listed on: 01/08/2015

Mel Foster Co. Commercial

Property Details

Property Type

  • Other

Year Built

  • Built in 1970

Lot Details

  • 0.37

Utilities

  • Forced Air Heating System
  • Heating System Uses Gas

Property Details

Property Type

Other

Year Built

Built in 1970

Lot Details

0

Listing Details

  • Class: Commercial/Cie
  • Type: Commercial/Cie
  • Sub Type: Retail
  • Year Built: 1970
  • Handicap Modified: Yes
  • Special Features: None
  • Property Sub Type: Other

Interior Features

  • Flooring: Concrete
  • Min Ceiling Ht Feet: 8
  • Min Ceiling Ht Inches: 96
  • Total Building Sq Ft: 2364
  • Estimated Lot Sq Ft: 16262

Exterior Features

  • Exterior Finish: Concrete
  • Frontage Access: Paved 4Lane, Corner Lot, City Street
  • Insulation: Roof, Side Walls
  • Roof Construction: Tar/Gravel, Tile
  • Wall Construction: Frame

Garage/Parking

  • Numberparking Spaces Allocated: 30

Utilities

  • Cooling: Individual Units
  • Heating: Forced Air, Gas
  • Water Supply: Municipal/City

Lot Info

  • Estimated Number of Acres: 0.37
  • Zoning: C-2
  • Geo Subdivision: IA

Rental Info

  • Owner Pays: None
  • Sale Lease Includes: Building, Land
  • Tenant Pays: None
  • Terms Lease: N/A

Tax Info

  • Annual Taxes: 3778
  • Parcel Id Number Tax Id: c0016-08A
  • Tax Incentive: In City Limit
  • Tax Year: 2013

Range of Values:

Collateral Analytics

Collateral Analytics Collateral Analytics AVMs (Automated Valuation Model) employ a number of statistical approaches combined with neighborhood-specific comparable selection guarantees the most up-to-date and precise valuations.

Not Available

Collateral Analytics does not have data for the current month. Please view the chart for historical values.

ICE

ICE Mortgage Technology ICE Mortgage Technology’s AVM (Automated Valuation Model) is a state-of-the-art online residential property valuation tool that provides a quick and accurate estimate of the value of almost any home in the U.S.

Not Available

ICE Mortgage Technology does not have data for the current month. Please view the chart for historical values.

First American

First American First American Data & Analytics’ next-generation AVM combines unrivaled data assets with a blended ensemble of valuation models to produce highly accurate, reliable valuations you can trust.

Not Available

First American does not have data for the current month. Please view the chart for historical values.

Quantarium

Quantarium Quantarium’s valuation service, repeatedly proven the industry’s most accurate and comprehensive, is supercharged with a self-learning and auto-tuning AI engine that continually becomes smarter and more accurate as it processes daily inputs from the industry’s leading RE data lake.

Not Available

Quantarium does not have data for the current month. Please view the chart for historical values.

Average Value
Not Available
List Price
Sold Price
Create a Home Valuation Report for This Property
The Home Valuation Report is an in-depth analysis detailing your home's value as well as a comparison with similar homes in the area

Home Values in the Area

Source: Public Records

Average Home Value in this Area


Source: Public Records

Mortgage History

Date Status Borrower Loan Amount
Closed Shivam Invesments Llc $244,875
Source: Public Records

Property History

Date Event Price Change Sq Ft Price
04/15/2015 04/15/15 Sold $140,000 -17.2% $59 / Sq Ft
03/19/2015 03/19/15 Pending -- -- --
01/08/2015 01/08/15 For Sale $169,000 -- $71 / Sq Ft
Source: RMLS Alliance

Tax History Compared to Growth

Source: Public Records

Tax History

Year Tax Paid Tax Assessment Tax Assessment Total Assessment is a certain percentage of the fair market value that is determined by local assessors to be the total taxable value of land and additions on the property. Land Improvement
2024 $6,665 $210,900 $95,900 $115,000
2023 $4,770 $210,900 $95,900 $115,000
2022 $5,708 $157,040 $95,900 $61,140
2021 $5,602 $157,040 $95,900 $61,140
2020 $5,924 $157,040 $95,900 $61,140
2019 $5,900 $154,680 $95,900 $58,780
2018 $125 $154,680 $95,900 $58,780
2017 $1,392 $154,680 $95,900 $58,780
2016 $3,746 $99,100 $0 $0
2015 $3,512 $99,100 $0 $0
2014 $3,554 $99,100 $0 $0
2013 $3,778 $0 $0 $0
2012 -- $99,100 $48,800 $50,300
Source: Public Records

Agents Affiliated with this Home

  • Section Image
See All Agents

Map

Source: RMLS Alliance

MLS Number: RMAQC7032781

RMLS Alliance

APN: C0016-08A