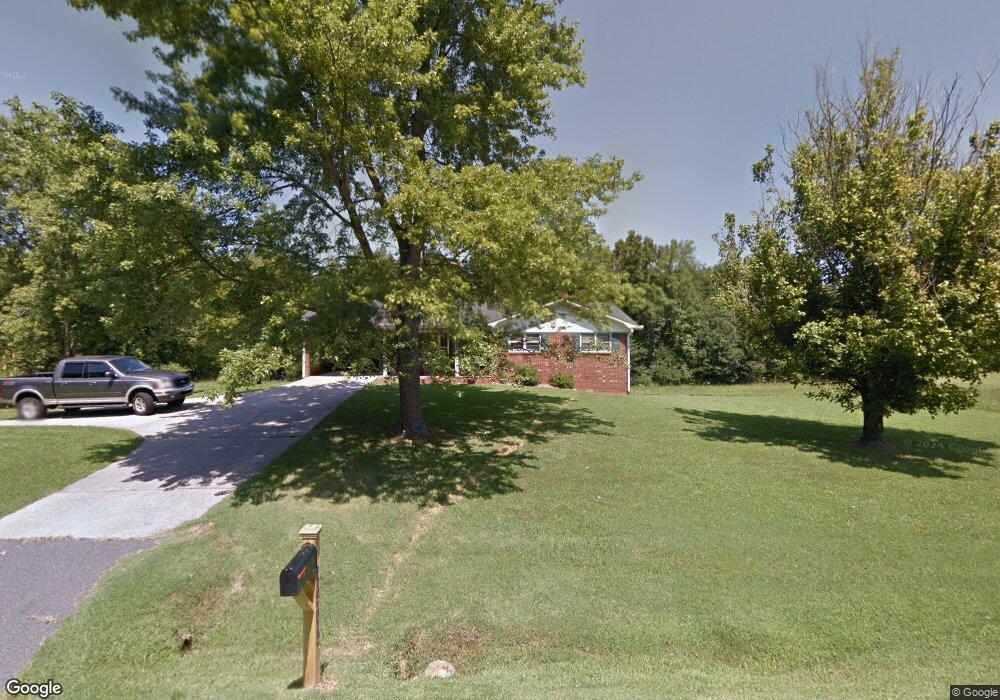
2905 Et Camp Rd Morganton, NC 28655
Estimated Value: $257,127 - $309,000
3
Beds
2
Baths
1,438
Sq Ft
$201/Sq Ft
Est. Value
About This Home
This home is located at 2905 Et Camp Rd, Morganton, NC 28655 and is currently estimated at $288,782, approximately $200 per square foot. 2905 Et Camp Rd is a home located in Burke County with nearby schools including Drexel Elementary School, Heritage Middle School, and Jimmy C. Draughn High School.
Ownership History
Date
Name
Owned For
Owner Type
Purchase Details
Closed on
Jun 29, 2017
Sold by
Gentry Scott
Bought by
Rose Erik L and Greene Sheila A
Current Estimated Value
Home Financials for this Owner
Home Financials are based on the most recent Mortgage that was taken out on this home.
Original Mortgage
$147,800
Outstanding Balance
$125,182
Interest Rate
4.62%
Mortgage Type
Adjustable Rate Mortgage/ARM
Estimated Equity
$163,600
Purchase Details
Closed on
Oct 15, 2015
Sold by
Gentry Scott A and Gentry Stephanie C
Bought by
Gentry Scott
Purchase Details
Closed on
Mar 23, 2009
Sold by
Gentry William and Gentry Janice C
Bought by
Gentry Scott A and Gentry Stephanie C
Create a Home Valuation Report for This Property
The Home Valuation Report is an in-depth analysis detailing your home's value as well as a comparison with similar homes in the area
Home Values in the Area
Average Home Value in this Area
Purchase History
| Date | Buyer | Sale Price | Title Company |
|---|---|---|---|
| Rose Erik L | $146,000 | Attorney | |
| Rose Erik L | $146,000 | Attorney | |
| Gentry Scott | -- | Ravenswood Title Company Llc | |
| Gentry Scott | -- | Ravenswood Title Company Llc | |
| Gentry Scott A | $118,000 | None Available | |
| Gentry Scott A | $118,000 | None Available |
Source: Public Records
Mortgage History
| Date | Status | Borrower | Loan Amount |
|---|---|---|---|
| Open | Rose Erik L | $147,800 |
Source: Public Records
Tax History
| Year | Tax Paid | Tax Assessment Tax Assessment Total Assessment is a certain percentage of the fair market value that is determined by local assessors to be the total taxable value of land and additions on the property. | Land | Improvement |
|---|---|---|---|---|
| 2025 | $1,385 | $197,430 | $31,621 | $165,809 |
| 2024 | $1,391 | $197,430 | $31,621 | $165,809 |
| 2023 | $1,391 | $197,430 | $31,621 | $165,809 |
| 2022 | $1,096 | $131,130 | $27,496 | $103,634 |
| 2021 | $1,090 | $131,130 | $27,496 | $103,634 |
| 2020 | $1,086 | $131,130 | $27,496 | $103,634 |
| 2019 | $1,086 | $131,130 | $27,496 | $103,634 |
| 2018 | $1,078 | $130,143 | $27,496 | $102,647 |
| 2017 | $978 | $117,523 | $28,538 | $88,985 |
| 2016 | $956 | $117,523 | $28,538 | $88,985 |
| 2015 | $953 | $117,523 | $28,538 | $88,985 |
| 2014 | $951 | $117,523 | $28,538 | $88,985 |
| 2013 | $951 | $117,523 | $28,538 | $88,985 |
Source: Public Records
Map
Nearby Homes
- 2088 E Winds Ave
- 2169 E Winds Ave
- 1855 Eastbrook Cir
- 1919 Highway 70 E
- 2290 U S 70
- 2986 Green Pasture Ln
- 0 Buford Dr
- 2491 Watts St
- 2269 Drexel Heights St
- 113, 119 Byrd St
- 106 River Hills Way
- 0 Amherst Rd
- 3435 Nelson Ln
- 2715 Moose Lodge St
- 308 Park Ave Unit 310
- 731 Summers Rd
- 102 Page St
- 113 Williams Way
- 2949 Woodwind Dr
- 1486 Huffman Bridge Rd
Your Personal Tour Guide
Ask me questions while you tour the home.