2905 Front St Alhambra, CA 91803
Alhambra Hills NeighborhoodEstimated Value: $724,000 - $815,000
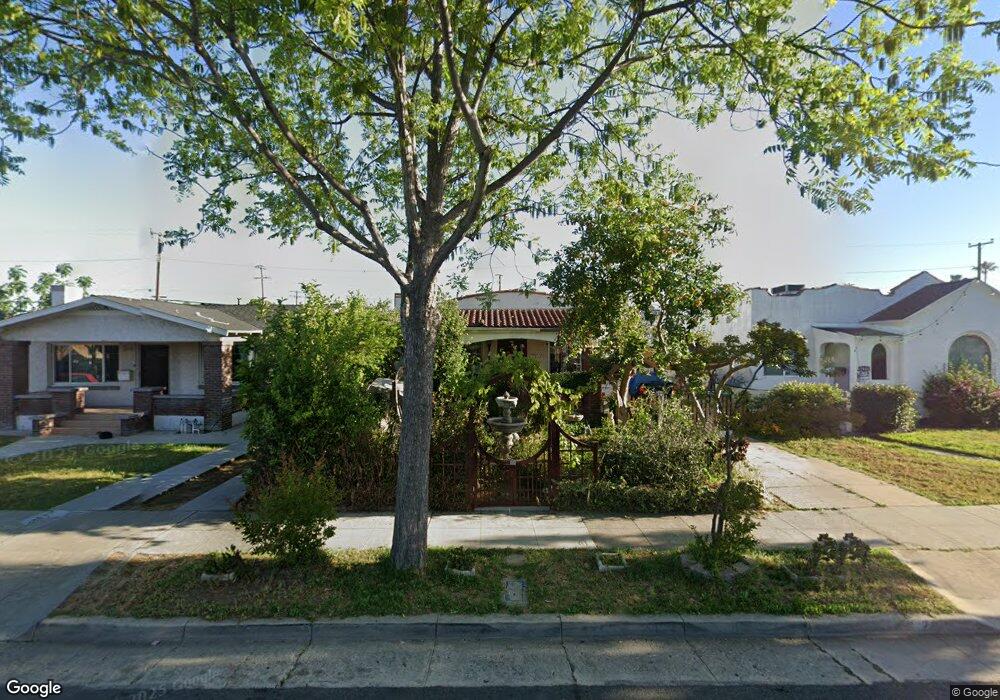
About This Home
This home is located at 2905 Front St, Alhambra, CA 91803 and is currently estimated at $765,534, approximately $824 per square foot. 2905 Front St is a home located in Los Angeles County with nearby schools including Fremont Elementary School, Alhambra High School, and St. Thomas More Catholic Elementary School.
Ownership History
We collect this data history from publicly available records. To have your information removed, we recommend requesting removal directly through your county’s website.
Purchase Details
Home Financials for this Owner
Home Financials are based on the most recent Mortgage that was taken out on this home.Purchase Details
Home Financials for this Owner
Home Financials are based on the most recent Mortgage that was taken out on this home.Purchase Details
Home Financials for this Owner
Home Financials are based on the most recent Mortgage that was taken out on this home.Home Values in the Area
Average Home Value in this Area
Purchase History
We collect this data history from publicly available records. To have your information removed, we recommend requesting removal directly through your county’s website.
| Date | Buyer | Sale Price | Title Company |
|---|---|---|---|
| -- | Financial Title Company | ||
| -- | United Title Company | ||
| -- | United Title Company |
Mortgage History
We collect this data history from publicly available records. To have your information removed, we recommend requesting removal directly through your county’s website.
| Date | Status | Borrower | Loan Amount |
|---|---|---|---|
| Closed | $348,000 | ||
| Closed | $137,375 |
Tax History
We collect this data history from publicly available records. To have your information removed, we recommend requesting removal directly through your county’s website.
| Year | Tax Paid | Tax Assessment Tax Assessment Total Assessment is a certain percentage of the fair market value that is determined by local assessors to be the total taxable value of land and additions on the property. | Land | Improvement |
|---|---|---|---|---|
| 2025 | $3,975 | $299,298 | $246,610 | $52,688 |
| 2024 | $3,849 | $293,430 | $241,775 | $51,655 |
| 2023 | $3,835 | $287,678 | $237,035 | $50,643 |
| 2022 | $3,659 | $282,038 | $232,388 | $49,650 |
| 2021 | $3,620 | $276,509 | $227,832 | $48,677 |
| 2019 | $3,498 | $268,309 | $221,075 | $47,234 |
| 2018 | $3,484 | $263,049 | $216,741 | $46,308 |
| 2016 | $3,211 | $252,836 | $208,326 | $44,510 |
| 2015 | $3,164 | $249,039 | $205,197 | $43,842 |
| 2014 | $3,129 | $244,162 | $201,178 | $42,984 |
Map
- 2904 Front St
- 2925 W Shorb St
- 1405 Westminster Ave
- 1324 Milton Ave
- 1608 Elm St
- 1342 Edgewood Dr
- 1705 S Fremont Ave
- 1607 Westmont Dr
- 1300 S Date Ave
- 2334 Highbury Ave
- 1305 S Ethel Ave
- 1100 S Ethel Ave
- 2917 W Hellman Ave
- 2345 Highbury Ave Unit 22
- 2205 W Ramona Rd
- 2324 Lillyvale Ave Unit 143
- 2121 El Paseo
- 2148 Edgewood Dr
- 5317 Cronus St
- 1623 W Glendon Way
Ask me questions while you tour the home.