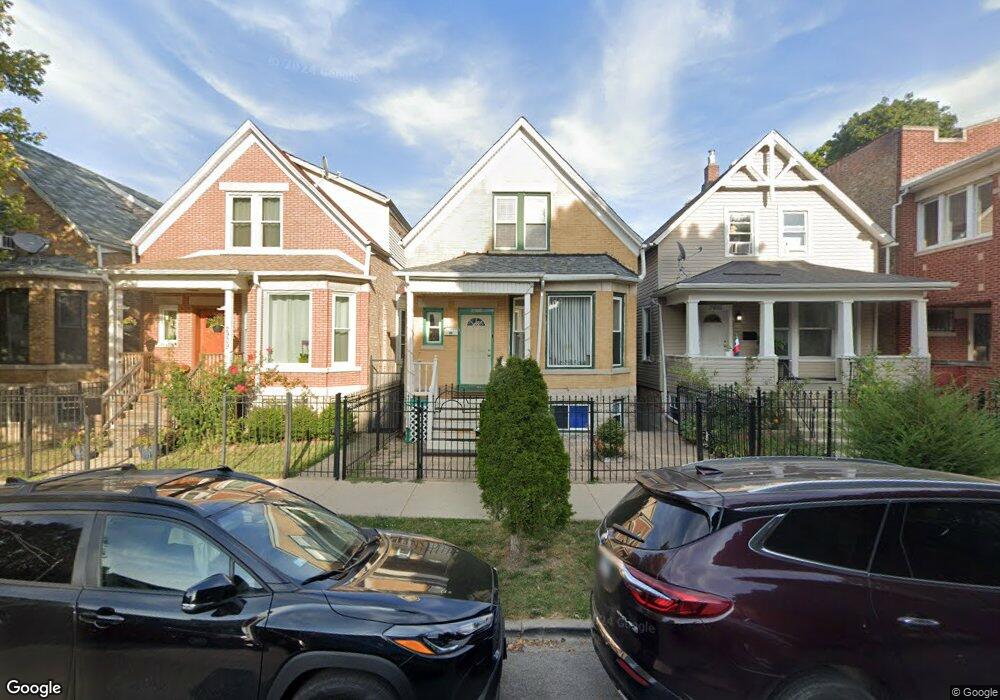
2905 N Troy St Chicago, IL 60618
Avondale NeighborhoodEstimated Value: $400,000 - $782,000
3
Beds
1
Bath
1,423
Sq Ft
$420/Sq Ft
Est. Value
About This Home
This home is located at 2905 N Troy St, Chicago, IL 60618 and is currently estimated at $597,535, approximately $419 per square foot. 2905 N Troy St is a home located in Cook County with nearby schools including Avondale-Logandale Elementary School, Schurz High School, and Acero Charter - Carlos Fuentes Cmpus.
Ownership History
Date
Name
Owned For
Owner Type
Purchase Details
Closed on
Jun 29, 2005
Sold by
Medina Victor
Bought by
Jimenez Eduardo
Current Estimated Value
Home Financials for this Owner
Home Financials are based on the most recent Mortgage that was taken out on this home.
Original Mortgage
$299,920
Outstanding Balance
$159,639
Interest Rate
6.37%
Mortgage Type
New Conventional
Estimated Equity
$437,896
Purchase Details
Closed on
May 1, 2002
Sold by
Medina Victor and Medina Armando
Bought by
Medina Victor
Home Financials for this Owner
Home Financials are based on the most recent Mortgage that was taken out on this home.
Original Mortgage
$193,750
Interest Rate
7.07%
Mortgage Type
Stand Alone First
Purchase Details
Closed on
Mar 31, 1997
Sold by
Moreno Francisco and Moreno Emma
Bought by
Medina Victor and Medina Armando
Home Financials for this Owner
Home Financials are based on the most recent Mortgage that was taken out on this home.
Original Mortgage
$133,998
Interest Rate
8%
Mortgage Type
FHA
Create a Home Valuation Report for This Property
The Home Valuation Report is an in-depth analysis detailing your home's value as well as a comparison with similar homes in the area
Home Values in the Area
Average Home Value in this Area
Purchase History
| Date | Buyer | Sale Price | Title Company |
|---|---|---|---|
| Jimenez Eduardo | $375,000 | Heritage Title Company | |
| Medina Victor | -- | -- | |
| Medina Victor | $135,000 | Attorneys Natl Title Network |
Source: Public Records
Mortgage History
| Date | Status | Borrower | Loan Amount |
|---|---|---|---|
| Open | Jimenez Eduardo | $299,920 | |
| Previous Owner | Medina Victor | $193,750 | |
| Previous Owner | Medina Victor | $133,998 |
Source: Public Records
Tax History
| Year | Tax Paid | Tax Assessment Tax Assessment Total Assessment is a certain percentage of the fair market value that is determined by local assessors to be the total taxable value of land and additions on the property. | Land | Improvement |
|---|---|---|---|---|
| 2025 | $9,777 | $43,223 | $19,530 | $23,693 |
| 2024 | $9,777 | $43,223 | $19,530 | $23,693 |
| 2023 | $9,828 | $49,489 | $15,750 | $33,739 |
| 2022 | $9,828 | $51,040 | $15,750 | $35,290 |
| 2021 | $9,626 | $51,040 | $15,750 | $35,290 |
| 2020 | $7,047 | $34,624 | $8,977 | $25,647 |
| 2019 | $6,981 | $38,049 | $8,977 | $29,072 |
| 2018 | $7,102 | $39,387 | $8,977 | $30,410 |
| 2017 | $5,634 | $29,547 | $7,875 | $21,672 |
| 2016 | $5,916 | $32,036 | $7,875 | $24,161 |
| 2015 | $5,390 | $32,036 | $7,875 | $24,161 |
| 2014 | $4,778 | $28,323 | $6,300 | $22,023 |
| 2013 | $4,673 | $28,323 | $6,300 | $22,023 |
Source: Public Records
Map
Nearby Homes
- 3142 W George St Unit C3
- 2925 N Troy St
- 2917 N Kedzie Ave
- 2921 N Kedzie Ave
- 3149 W Wellington Ave Unit 1
- 2837 N Sawyer Ave Unit 3R
- 2915 N Spaulding Ave
- 3023 W Wellington Ave
- 3009 N Whipple St
- 3036 N Kedzie Ave
- 2708 N Albany Ave
- 2862 N Woodard St
- 3103 N Kedzie Ave
- 2710 N Sacramento Ave
- 2629 N Troy St
- 2854 N Francisco Ave
- 3051 N Christiana Ave
- 3055 N Christiana Ave
- 3057 N Christiana Ave
- 3011 N Kimball Ave
- 2903 N Troy St
- 2909 N Troy St Unit 1
- 2909 N Troy St Unit 2
- 2901 N Troy St
- 2911 N Troy St
- 2911 N Troy St Unit 1
- 2911 N Troy St Unit B
- 2913 N Troy St Unit 1
- 2917 N Troy St
- 3119 W George St Unit 1
- 2908 N Albany Ave
- 2857 N Troy St Unit 2
- 2857 N Troy St Unit 1
- 2857 N Troy St
- 3142 W George St Unit C2
- 3142 W George St Unit C2
- 3142 W George St Unit C3
- 3142 W George St Unit C-1
- 2902 N Albany Ave
- 2902 N Albany Ave
Your Personal Tour Guide
Ask me questions while you tour the home.