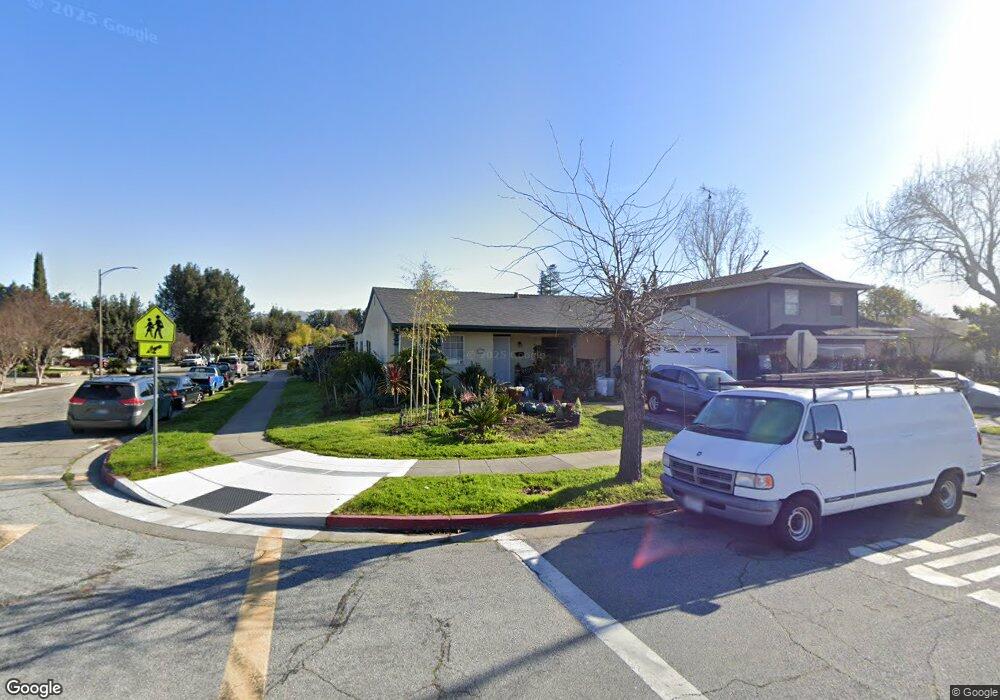
2906 Aetna Way San Jose, CA 95121
Stonegate NeighborhoodEstimated Value: $1,464,000 - $1,574,000
4
Beds
4
Baths
1,703
Sq Ft
$895/Sq Ft
Est. Value
About This Home
This home is located at 2906 Aetna Way, San Jose, CA 95121 and is currently estimated at $1,524,129, approximately $894 per square foot. 2906 Aetna Way is a home located in Santa Clara County with nearby schools including Windmill Springs Elementary School, Sylvandale Middle School, and Yerba Buena High School.
Ownership History
Date
Name
Owned For
Owner Type
Purchase Details
Closed on
Jun 17, 2002
Sold by
Simms Gregory
Bought by
Yin Lun and Kong Sina
Current Estimated Value
Home Financials for this Owner
Home Financials are based on the most recent Mortgage that was taken out on this home.
Original Mortgage
$368,000
Outstanding Balance
$146,656
Interest Rate
6%
Estimated Equity
$1,377,473
Purchase Details
Closed on
Aug 23, 2001
Sold by
Mam Samreth
Bought by
Simms Gregory
Home Financials for this Owner
Home Financials are based on the most recent Mortgage that was taken out on this home.
Original Mortgage
$355,200
Interest Rate
7.09%
Purchase Details
Closed on
Dec 29, 1998
Sold by
Horacio Longoria and Horacio Delia Y
Bought by
Mam Samreth
Home Financials for this Owner
Home Financials are based on the most recent Mortgage that was taken out on this home.
Original Mortgage
$247,350
Interest Rate
10.37%
Create a Home Valuation Report for This Property
The Home Valuation Report is an in-depth analysis detailing your home's value as well as a comparison with similar homes in the area
Home Values in the Area
Average Home Value in this Area
Purchase History
| Date | Buyer | Sale Price | Title Company |
|---|---|---|---|
| Yin Lun | $460,000 | Alliance Title Company | |
| Simms Gregory | $444,000 | Fidelity National Title Co | |
| Mam Samreth | $309,500 | North American Title Co |
Source: Public Records
Mortgage History
| Date | Status | Borrower | Loan Amount |
|---|---|---|---|
| Open | Yin Lun | $368,000 | |
| Previous Owner | Simms Gregory | $355,200 | |
| Previous Owner | Mam Samreth | $247,350 | |
| Closed | Mam Samreth | $61,800 | |
| Closed | Simms Gregory | $66,600 | |
| Closed | Yin Lun | $46,000 |
Source: Public Records
Tax History Compared to Growth
Tax History
| Year | Tax Paid | Tax Assessment Tax Assessment Total Assessment is a certain percentage of the fair market value that is determined by local assessors to be the total taxable value of land and additions on the property. | Land | Improvement |
|---|---|---|---|---|
| 2025 | $12,800 | $862,507 | $132,943 | $729,564 |
| 2024 | $12,800 | $845,596 | $130,337 | $715,259 |
| 2023 | $12,638 | $829,017 | $127,782 | $701,235 |
| 2022 | $12,342 | $812,763 | $125,277 | $687,486 |
| 2021 | $11,958 | $730,788 | $122,821 | $607,967 |
| 2020 | $9,267 | $621,352 | $121,562 | $499,790 |
| 2019 | $8,887 | $609,170 | $119,179 | $489,991 |
| 2018 | $8,882 | $597,227 | $116,843 | $480,384 |
| 2017 | $8,838 | $585,517 | $114,552 | $470,965 |
| 2016 | $8,403 | $574,037 | $112,306 | $461,731 |
| 2015 | $8,230 | $565,416 | $110,620 | $454,796 |
| 2014 | $6,936 | $492,000 | $96,300 | $395,700 |
Source: Public Records
Map
Nearby Homes
- 3016 Shadow Springs Place Unit 113
- 3241 Shadow Park Place
- 3326 Shadow Park Place
- 3354 Shadow Park Place Unit 319
- 1520 E Capitol Expy
- 1520 E Capitol Expy Unit 29
- 2566 Boren Dr
- 2748 Aida Ave
- 3463 Sugarcreek Ct
- 2647 Aida Ave
- 1189 Oakview Rd
- 3262 Firth Way
- 1051 Keldon Dr
- 3699 Cedar Knoll Ct
- 677 Dadis Way
- 1868 Bagpipe Way
- 653 Dadis Way
- 3233 Lone Bluff Way
- 2697 Lone Bluff Way
- 3843 Marfrance Dr
- 2914 Aetna Way
- 2907 Philip Ct
- 2915 Philip Ct
- 1303 Sylvia Dr
- 1311 Sylvia Dr
- 2905 Aetna Way
- 2913 Aetna Way Unit ID1310562P
- 2913 Aetna Way
- 1319 Sylvia Dr
- 2930 Aetna Way
- 1295 Sylvia Dr
- 2921 Aetna Way
- 1327 Sylvia Dr
- 1287 Sylvia Dr
- 2929 Aetna Way
- 2904 Erica Ct
- 2931 Philip Ct
- 2912 Erica Ct
- 2891 Aetna Way
- 2908 Philip Ct