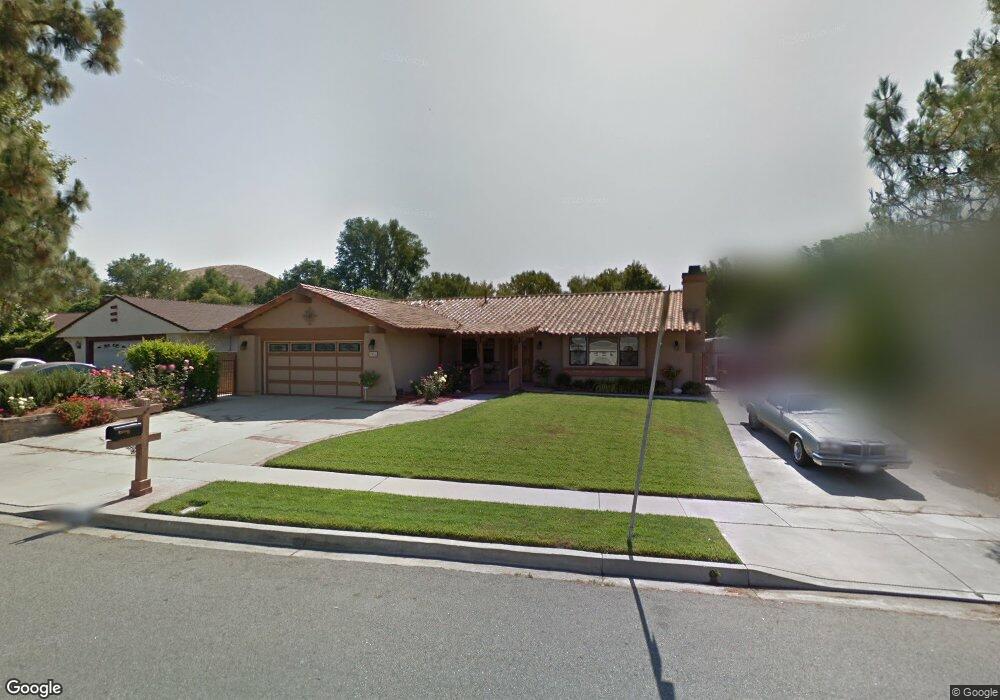
2906 Texas Ave Simi Valley, CA 93063
East Simi Valley NeighborhoodEstimated Value: $896,000 - $969,000
4
Beds
2
Baths
1,823
Sq Ft
$508/Sq Ft
Est. Value
About This Home
This home is located at 2906 Texas Ave, Simi Valley, CA 93063 and is currently estimated at $926,677, approximately $508 per square foot. 2906 Texas Ave is a home located in Ventura County with nearby schools including Big Springs Elementary School, Valley View Middle School, and Simi Valley High School.
Ownership History
Date
Name
Owned For
Owner Type
Purchase Details
Closed on
Nov 20, 2020
Sold by
Pusateri Anita G and Pusateri Joseph V
Bought by
Pusateri Anita G and Pusateri Joseph V
Current Estimated Value
Purchase Details
Closed on
Jul 13, 2005
Sold by
Teitsworth Kathleen A
Bought by
Pusateri Anita G
Purchase Details
Closed on
Jan 16, 2002
Sold by
Teitsworth Kathleen A
Bought by
Teitsworth Kathleen A
Home Financials for this Owner
Home Financials are based on the most recent Mortgage that was taken out on this home.
Original Mortgage
$204,000
Interest Rate
6.9%
Purchase Details
Closed on
Mar 22, 1996
Sold by
Milburn Mark J
Bought by
Teitsworth Kathleen A
Purchase Details
Closed on
Jun 3, 1994
Sold by
Milburn Lloyd D
Bought by
Milburn Lloyd D
Create a Home Valuation Report for This Property
The Home Valuation Report is an in-depth analysis detailing your home's value as well as a comparison with similar homes in the area
Home Values in the Area
Average Home Value in this Area
Purchase History
| Date | Buyer | Sale Price | Title Company |
|---|---|---|---|
| Pusateri Anita G | -- | None Available | |
| Pusateri Anita G | $535,000 | Equity Title | |
| Teitsworth Kathleen A | -- | Ticor Title | |
| Teitsworth Kathleen A | -- | -- | |
| Milburn Lloyd D | -- | -- |
Source: Public Records
Mortgage History
| Date | Status | Borrower | Loan Amount |
|---|---|---|---|
| Previous Owner | Teitsworth Kathleen A | $204,000 |
Source: Public Records
Tax History Compared to Growth
Tax History
| Year | Tax Paid | Tax Assessment Tax Assessment Total Assessment is a certain percentage of the fair market value that is determined by local assessors to be the total taxable value of land and additions on the property. | Land | Improvement |
|---|---|---|---|---|
| 2025 | $4,985 | $396,156 | $128,422 | $267,734 |
| 2024 | $4,985 | $388,389 | $125,904 | $262,485 |
| 2023 | $4,686 | $380,774 | $123,435 | $257,339 |
| 2022 | $4,657 | $373,308 | $121,014 | $252,294 |
| 2021 | $4,692 | $365,989 | $118,641 | $247,348 |
| 2020 | $4,512 | $362,237 | $117,425 | $244,812 |
| 2019 | $4,305 | $355,135 | $115,123 | $240,012 |
| 2018 | $4,262 | $348,172 | $112,866 | $235,306 |
| 2017 | $4,163 | $341,346 | $110,653 | $230,693 |
| 2016 | $3,974 | $334,654 | $108,484 | $226,170 |
| 2015 | $3,885 | $329,629 | $106,855 | $222,774 |
| 2014 | $3,825 | $323,174 | $104,763 | $218,411 |
Source: Public Records
Map
Nearby Homes
- 2948 Texas Ave
- 2945 Dalhart Ave
- 4790 Adam Rd
- 5206 Seneca Place
- 3175 Corpus Christi St
- 2711 Stearns St Unit 4
- 3005 Mineral Wells Dr
- 2547 Canterbury Ln
- 4553 Alamo St Unit F
- 2511 Aurora Ln
- 4460 Lubbock Dr Unit B
- 4989 Cochran St
- 4679 Summit Ave
- 4683 Summit Ave
- 4759 Cochran St
- 40 Hanna
- 0 American Cut Off (Apn 649-0-020-010) Rd Unit SR25060657
- 28 Chivo
- 62 Las Lljas Canyon Rd
- 125 Fern Dr
- 2918 Texas Ave
- 2892 Texas Ave
- 2930 Texas Ave
- 2884 Texas Ave
- 2905 Texas Ave
- 2936 Texas Ave
- 2917 Texas Ave
- 2891 Texas Ave
- 2872 Texas Ave
- 2929 Texas Ave
- 2935 Texas Ave
- 2871 Texas Ave
- 2860 Texas Ave
- 2854 Corpus Christi St
- 2947 Texas Ave
- 2960 Texas Ave
- 2924 San Angelo Ave
- 2831 Corpus Christi St
- 2848 Texas Ave
- 2959 Texas Ave