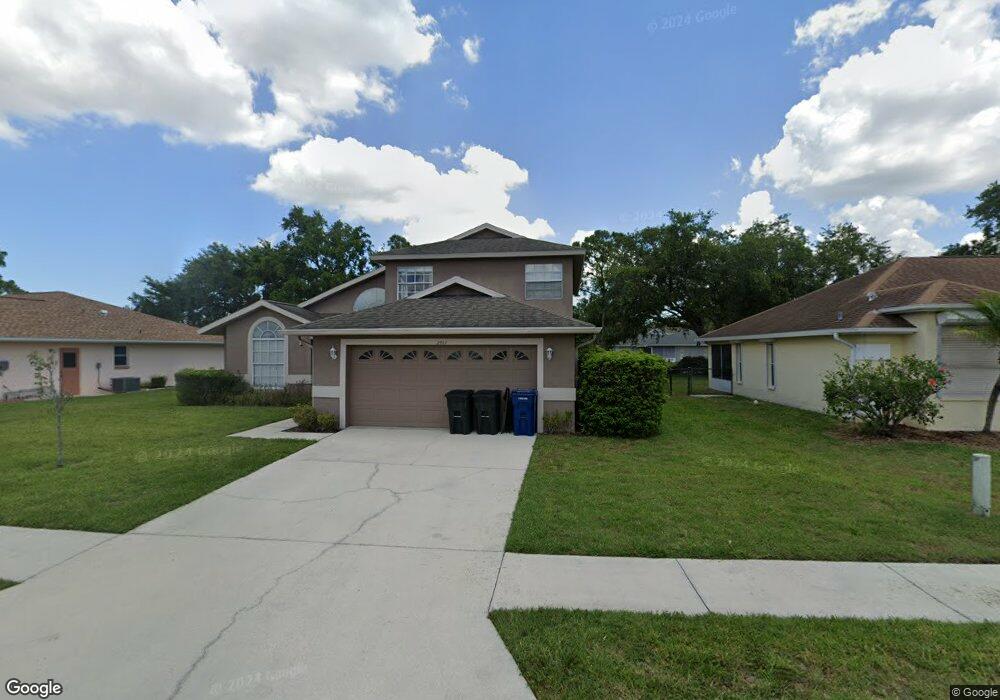
2907 57th Dr E Bradenton, FL 34203
East Bradenton NeighborhoodEstimated Value: $385,647 - $433,000
3
Beds
3
Baths
2,205
Sq Ft
$187/Sq Ft
Est. Value
About This Home
This home is located at 2907 57th Dr E, Bradenton, FL 34203 and is currently estimated at $412,412, approximately $187 per square foot. 2907 57th Dr E is a home located in Manatee County with nearby schools including Oneco Elementary School, Braden River Middle School, and Braden River High School.
Ownership History
Date
Name
Owned For
Owner Type
Purchase Details
Closed on
Jan 3, 2012
Sold by
Wells Fargo Bank Na
Bought by
Tran Hau V and Tran Hanh T
Current Estimated Value
Purchase Details
Closed on
Dec 28, 2011
Sold by
Wells Fargo Bank Na
Bought by
Tran Hau V and Tran Hahn T
Purchase Details
Closed on
Dec 13, 2011
Sold by
Chen Ben Jian and Lin Fang
Bought by
Wells Fargo Bank N A
Purchase Details
Closed on
Aug 2, 2005
Sold by
Lentz Lanny L and Lentz Debra A
Bought by
Chen Ben Jian and Lin Fang
Home Financials for this Owner
Home Financials are based on the most recent Mortgage that was taken out on this home.
Original Mortgage
$242,250
Interest Rate
5.57%
Mortgage Type
Stand Alone First
Purchase Details
Closed on
Oct 31, 1995
Sold by
J D H Const Inc
Bought by
Lentz Lanny L and Lentz Debra A
Home Financials for this Owner
Home Financials are based on the most recent Mortgage that was taken out on this home.
Original Mortgage
$111,300
Interest Rate
7.51%
Create a Home Valuation Report for This Property
The Home Valuation Report is an in-depth analysis detailing your home's value as well as a comparison with similar homes in the area
Home Values in the Area
Average Home Value in this Area
Purchase History
| Date | Buyer | Sale Price | Title Company |
|---|---|---|---|
| Tran Hau V | -- | Century Title Closing & Escr | |
| Tran Hau V | $142,500 | Century Title Closing & Escr | |
| Wells Fargo Bank N A | $95,100 | Attorney | |
| Chen Ben Jian | $323,000 | Fidelity National Title Ins | |
| Lentz Lanny L | $123,700 | -- |
Source: Public Records
Mortgage History
| Date | Status | Borrower | Loan Amount |
|---|---|---|---|
| Previous Owner | Chen Ben Jian | $242,250 | |
| Previous Owner | Lentz Lanny L | $111,300 |
Source: Public Records
Tax History
| Year | Tax Paid | Tax Assessment Tax Assessment Total Assessment is a certain percentage of the fair market value that is determined by local assessors to be the total taxable value of land and additions on the property. | Land | Improvement |
|---|---|---|---|---|
| 2025 | $5,244 | $336,746 | $45,900 | $290,846 |
| 2023 | $5,146 | $377,567 | $45,900 | $331,667 |
| 2022 | $4,626 | $327,714 | $45,000 | $282,714 |
| 2021 | $3,761 | $233,460 | $40,000 | $193,460 |
| 2020 | $3,708 | $219,243 | $35,000 | $184,243 |
| 2019 | $3,659 | $214,641 | $35,000 | $179,641 |
| 2018 | $3,628 | $210,742 | $34,000 | $176,742 |
| 2017 | $1,616 | $129,573 | $0 | $0 |
| 2016 | $1,600 | $126,908 | $0 | $0 |
Source: Public Records
Map
Nearby Homes
- 5717 28th St E
- 3039 58th Terrace E
- 3157 57th Avenue Cir E
- 3109 57th Avenue Cir E
- 5528 24th St E
- 3510 56th Terrace E
- 3427 55th Dr E
- 5311 24th Street Ct E
- 5612 22nd St E
- 5714 Garden Lakes Fern
- 5721 Garden Lakes Majestic
- 5608 Garden Lakes Dr Unit 16
- 5729 Garden Lakes Palm
- 6115 33rd St E
- 5711 Garden Lakes Palm Unit 84
- 5611 Garden Lakes Dr Unit 17
- 5523 Spanish Moss Cove
- 5538 Spanish Moss Cove
- 5542 Spanish Moss Cove
- 5803 Garden Lakes Dr Unit 145
- 2911 57th Dr E
- 2903 57th Dr E
- 2915 57th Dr E
- 5702 29th Ct E
- 5707 29th St E Unit 4
- 5655 E 29th St
- 5631 29th St E
- 5602 29th Street Cir E
- 2831 57th Dr E Unit 4
- 5602 29th Street Cir E
- 2919 57th Dr E
- 5711 29th St E
- 5627 Street E
- 5627 29th St E
- 5627 29th St E
- 2802 56th Avenue Cir E
- 5705 29th Ct E
- 2802 56th Ave Cir E
- 5604 29th Street Cir E
- 5604 29th St Cir E
Your Personal Tour Guide
Ask me questions while you tour the home.