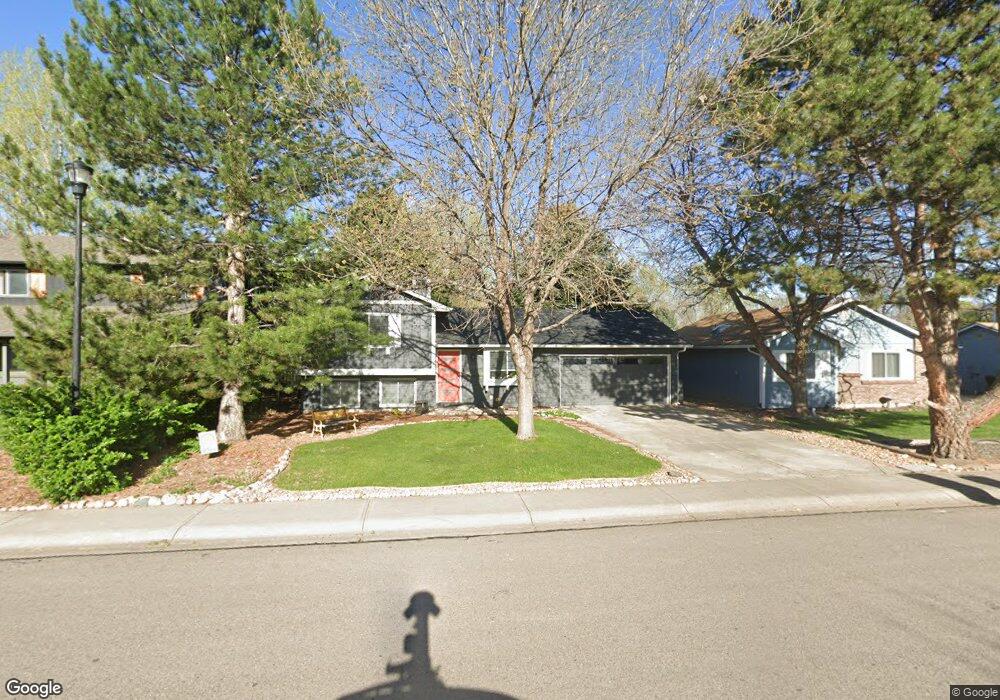
2907 Sombrero Ln Fort Collins, CO 80525
Meadows East NeighborhoodEstimated Value: $467,133 - $484,000
3
Beds
2
Baths
1,194
Sq Ft
$399/Sq Ft
Est. Value
About This Home
This home is located at 2907 Sombrero Ln, Fort Collins, CO 80525 and is currently estimated at $476,533, approximately $399 per square foot. 2907 Sombrero Ln is a home located in Larimer County with nearby schools including Shepardson Elementary School, Lesher Middle School, and Fort Collins High School.
Ownership History
Date
Name
Owned For
Owner Type
Purchase Details
Closed on
Jul 31, 2020
Sold by
Gulliksen Michael and Gulliksen Evelina
Bought by
Moberly Lance A and Moberly Kim A
Current Estimated Value
Home Financials for this Owner
Home Financials are based on the most recent Mortgage that was taken out on this home.
Original Mortgage
$278,000
Outstanding Balance
$247,061
Interest Rate
3.1%
Mortgage Type
New Conventional
Estimated Equity
$229,472
Purchase Details
Closed on
Jul 21, 2009
Sold by
Redmond Ott Teresa A and Redmond Ott Randy L
Bought by
Gulliksen Michael and Gulliksen Evelina
Home Financials for this Owner
Home Financials are based on the most recent Mortgage that was taken out on this home.
Original Mortgage
$191,860
Interest Rate
5.71%
Mortgage Type
FHA
Purchase Details
Closed on
Sep 1, 1995
Sold by
Smith Maria Lourdes
Bought by
Redmond-Ott Randy L
Purchase Details
Closed on
Sep 1, 1993
Sold by
Smith Maria Lourdes A
Bought by
Smith Maria Lourdes
Create a Home Valuation Report for This Property
The Home Valuation Report is an in-depth analysis detailing your home's value as well as a comparison with similar homes in the area
Home Values in the Area
Average Home Value in this Area
Purchase History
| Date | Buyer | Sale Price | Title Company |
|---|---|---|---|
| Moberly Lance A | $347,500 | Land Title Guarantee Co | |
| Gulliksen Michael | $195,400 | Tggt | |
| Redmond-Ott Randy L | $109,000 | -- | |
| Smith Maria Lourdes | -- | -- |
Source: Public Records
Mortgage History
| Date | Status | Borrower | Loan Amount |
|---|---|---|---|
| Open | Moberly Lance A | $278,000 | |
| Previous Owner | Gulliksen Michael | $191,860 |
Source: Public Records
Tax History Compared to Growth
Tax History
| Year | Tax Paid | Tax Assessment Tax Assessment Total Assessment is a certain percentage of the fair market value that is determined by local assessors to be the total taxable value of land and additions on the property. | Land | Improvement |
|---|---|---|---|---|
| 2025 | $2,538 | $30,137 | $2,412 | $27,725 |
| 2024 | $2,415 | $30,137 | $2,412 | $27,725 |
| 2022 | $2,132 | $22,574 | $2,502 | $20,072 |
| 2021 | $2,154 | $23,223 | $2,574 | $20,649 |
| 2020 | $2,103 | $22,472 | $2,574 | $19,898 |
| 2019 | $2,112 | $22,472 | $2,574 | $19,898 |
| 2018 | $1,728 | $18,965 | $2,592 | $16,373 |
| 2017 | $1,723 | $18,965 | $2,592 | $16,373 |
| 2016 | $1,481 | $16,223 | $2,866 | $13,357 |
| 2015 | $1,470 | $16,230 | $2,870 | $13,360 |
| 2014 | $1,294 | $14,190 | $2,870 | $11,320 |
Source: Public Records
Map
Nearby Homes
- 2961 Sagebrush Dr
- 3012 Sombrero Ln
- 2750 Illinois Dr Unit 206
- 3036 Regatta Ln Unit 2
- 2241 Limon Dr Unit 204
- 1706 Lakeshore Dr
- 2550 Custer Dr
- 2450 Windrow Dr Unit E106
- 2450 Windrow Dr Unit E203
- 2521 Des Moines Dr Unit 104
- 2556 Des Moines Dr Unit 103
- 1724 Westchester Ln
- 1730 Tanglewood Dr
- 2702 Rigden Pkwy Unit 1
- 2702 Rigden Pkwy Unit F4
- 2120 Katahdin Dr
- 2287 Trestle Rd
- 2926 Brookwood Place
- 3500 Carlton Ave Unit U49
- 2263 Adobe Dr
- 2901 Sombrero Ln
- 2913 Sombrero Ln
- 2837 Sombrero Ln
- 2919 Sombrero Ln
- 2906 Sagebrush Dr
- 2900 Sagebrush Dr
- 2912 Sagebrush Dr
- 2918 Sagebrush Dr
- 2836 Sagebrush Dr
- 2831 Sombrero Ln
- 2925 Sombrero Ln
- 2906 Sombrero Ln
- 2900 Sombrero Ln
- 2912 Sombrero Ln
- 2924 Sagebrush Dr
- 2830 Sagebrush Dr
- 2836 Sombrero Ln
- 2918 Sombrero Ln
- 2825 Sombrero Ln
- 2828 Sagebrush Dr