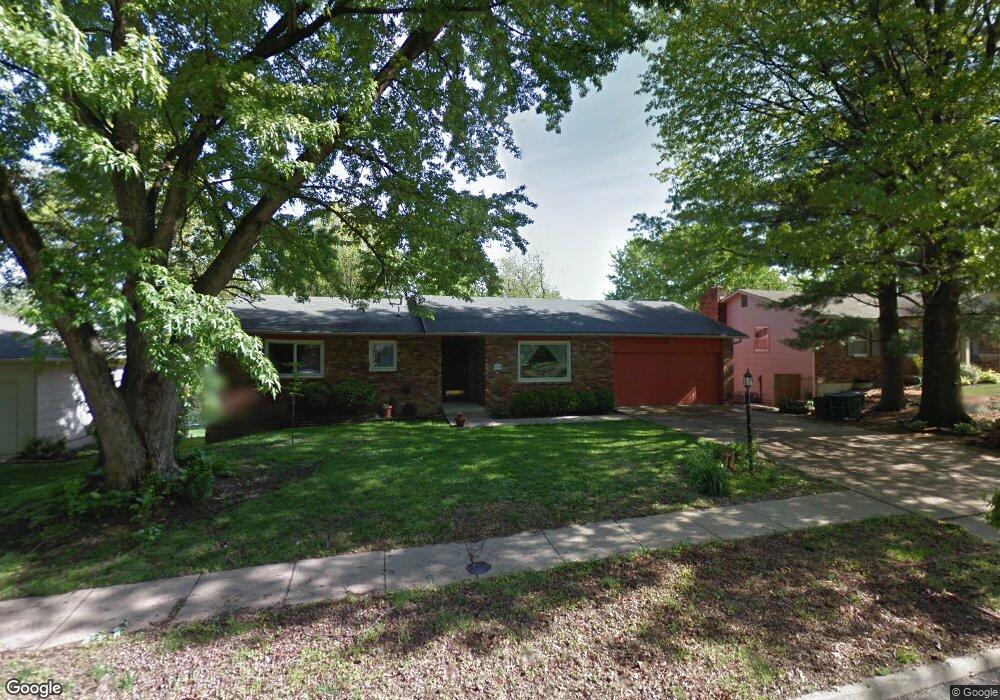
2908 Chisholm Dr Lawrence, KS 66047
Prairie Meadows NeighborhoodEstimated Value: $409,000 - $451,000
4
Beds
3
Baths
3,122
Sq Ft
$138/Sq Ft
Est. Value
About This Home
This home is located at 2908 Chisholm Dr, Lawrence, KS 66047 and is currently estimated at $430,625, approximately $137 per square foot. 2908 Chisholm Dr is a home located in Douglas County with nearby schools including Schwegler Elementary School, Billy Mills Middle School, and Lawrence High School.
Ownership History
Date
Name
Owned For
Owner Type
Purchase Details
Closed on
Jun 27, 2019
Sold by
Delcampo April and Mendez Javier
Bought by
Lorenz Lisa and Helbing Matthew
Current Estimated Value
Home Financials for this Owner
Home Financials are based on the most recent Mortgage that was taken out on this home.
Original Mortgage
$248,000
Outstanding Balance
$218,068
Interest Rate
4%
Mortgage Type
New Conventional
Estimated Equity
$212,557
Purchase Details
Closed on
Jan 16, 2018
Sold by
Campo Maria Magdalena Del and Delcampo April Del
Bought by
Delcampo April Del and Mendez Javier
Home Financials for this Owner
Home Financials are based on the most recent Mortgage that was taken out on this home.
Original Mortgage
$215,200
Interest Rate
3.94%
Mortgage Type
New Conventional
Purchase Details
Closed on
Dec 3, 2002
Sold by
Delcampo Maria Magdalena and Delcampo April
Bought by
Delcampo Maria Magdalena and Delcampo April
Create a Home Valuation Report for This Property
The Home Valuation Report is an in-depth analysis detailing your home's value as well as a comparison with similar homes in the area
Home Values in the Area
Average Home Value in this Area
Purchase History
| Date | Buyer | Sale Price | Title Company |
|---|---|---|---|
| Lorenz Lisa | -- | Continental Title Company | |
| Delcampo April Del | -- | Security 1St Title | |
| Delcampo Maria Magdalena | -- | Commerce Title |
Source: Public Records
Mortgage History
| Date | Status | Borrower | Loan Amount |
|---|---|---|---|
| Open | Lorenz Lisa | $248,000 | |
| Previous Owner | Delcampo April Del | $215,200 |
Source: Public Records
Tax History Compared to Growth
Tax History
| Year | Tax Paid | Tax Assessment Tax Assessment Total Assessment is a certain percentage of the fair market value that is determined by local assessors to be the total taxable value of land and additions on the property. | Land | Improvement |
|---|---|---|---|---|
| 2025 | $6,022 | $48,312 | $7,475 | $40,837 |
| 2024 | $5,890 | $47,254 | $7,475 | $39,779 |
| 2023 | $5,513 | $42,780 | $5,520 | $37,260 |
| 2022 | $5,171 | $39,871 | $5,060 | $34,811 |
| 2021 | $4,798 | $35,869 | $4,830 | $31,039 |
| 2020 | $4,744 | $35,650 | $4,830 | $30,820 |
| 2019 | $3,625 | $27,347 | $4,830 | $22,517 |
| 2018 | $3,325 | $24,932 | $4,600 | $20,332 |
| 2017 | $3,212 | $23,828 | $4,600 | $19,228 |
| 2016 | $2,932 | $22,735 | $4,602 | $18,133 |
| 2015 | $2,949 | $22,862 | $4,602 | $18,260 |
| 2014 | $3,011 | $23,563 | $4,602 | $18,961 |
Source: Public Records
Map
Nearby Homes
- 3013 W 23rd Terrace
- 3018 Topeka Ln
- 2407 Yosemite Dr
- 2709 Lawrence Ave
- 2415 Bryce Ct
- 2726 Chipperfield Rd
- 2728 Chipperfield Rd
- 2139 Quail Creek Dr
- 3621 Brush Creek Dr
- 1840 Quail Creek Dr
- 1704 W 20th St
- 3700 Quail Creek Ct
- 1633 W 20th St
- 1620 W 20th Terrace
- 2018 Crossgate Dr
- 3239 Atchison Ave
- 1305 W 21st St
- 4142 Blackjack Oak Dr
- 1908 Crossgate Dr
- 1439 Applegate Ct
- 2904 Chisholm Dr
- 2912 Chisholm Dr
- 2909 Sagebrush Dr
- 2905 Sagebrush Dr
- 2913 Sagebrush Dr
- 2916 Chisholm Dr
- 2900 Chisholm Dr
- 2909 Chisholm Dr
- 2913 Chisholm Dr
- 2905 Chisholm Dr
- 2915 Sagebrush Dr
- 2901 Sagebrush Dr
- 2915 Chisholm Dr
- 2920 Chisholm Dr
- 2901 Chisholm Dr
- 2917 Sagebrush Dr
- 2908 Santa fe Ln
- 2908 Sagebrush Dr
- 2924 Chisholm Dr
- 2912 Santa fe Ln