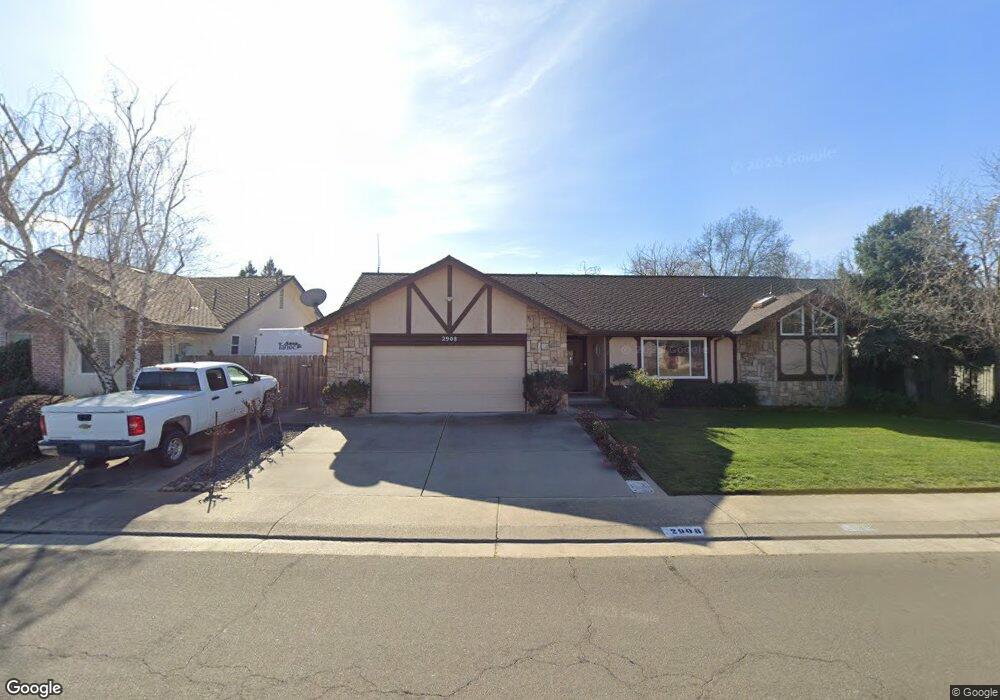
2908 Park Oak Dr Lodi, CA 95242
Sunwest NeighborhoodEstimated Value: $644,000 - $682,000
3
Beds
2
Baths
2,314
Sq Ft
$284/Sq Ft
Est. Value
About This Home
This home is located at 2908 Park Oak Dr, Lodi, CA 95242 and is currently estimated at $656,051, approximately $283 per square foot. 2908 Park Oak Dr is a home located in San Joaquin County with nearby schools including Erma B. Reese Elementary School, Millswood Middle School, and Lodi High School.
Ownership History
Date
Name
Owned For
Owner Type
Purchase Details
Closed on
Jul 25, 2013
Sold by
Johnson Wilburn C and Johnson Pamela S
Bought by
Johnson Wilburn C and Johnson Pamela S
Current Estimated Value
Home Financials for this Owner
Home Financials are based on the most recent Mortgage that was taken out on this home.
Original Mortgage
$82,000
Outstanding Balance
$20,000
Interest Rate
4.51%
Mortgage Type
New Conventional
Estimated Equity
$636,051
Purchase Details
Closed on
Jun 3, 2010
Sold by
Chiechi Giselle Marguerite
Bought by
Johnson Wilburn C and Johnson Pamela S
Home Financials for this Owner
Home Financials are based on the most recent Mortgage that was taken out on this home.
Original Mortgage
$276,800
Outstanding Balance
$177,610
Interest Rate
4.12%
Mortgage Type
New Conventional
Estimated Equity
$478,441
Purchase Details
Closed on
Oct 11, 1999
Sold by
Brenneise Ehud
Bought by
Skinner Jacqueline F
Create a Home Valuation Report for This Property
The Home Valuation Report is an in-depth analysis detailing your home's value as well as a comparison with similar homes in the area
Home Values in the Area
Average Home Value in this Area
Purchase History
| Date | Buyer | Sale Price | Title Company |
|---|---|---|---|
| Johnson Wilburn C | -- | Servicelink | |
| Johnson Wilburn C | $346,000 | Old Republic Title Company | |
| Skinner Jacqueline F | $249,000 | Fidelity National Title |
Source: Public Records
Mortgage History
| Date | Status | Borrower | Loan Amount |
|---|---|---|---|
| Open | Johnson Wilburn C | $82,000 | |
| Open | Johnson Wilburn C | $276,800 |
Source: Public Records
Tax History
| Year | Tax Paid | Tax Assessment Tax Assessment Total Assessment is a certain percentage of the fair market value that is determined by local assessors to be the total taxable value of land and additions on the property. | Land | Improvement |
|---|---|---|---|---|
| 2025 | $4,767 | $446,602 | $111,003 | $335,599 |
| 2024 | $4,636 | $437,846 | $108,827 | $329,019 |
| 2023 | $4,581 | $429,262 | $106,694 | $322,568 |
| 2022 | $4,477 | $420,846 | $104,602 | $316,244 |
| 2021 | $4,557 | $412,595 | $102,551 | $310,044 |
| 2020 | $4,438 | $408,365 | $101,500 | $306,865 |
| 2019 | $4,347 | $400,359 | $99,510 | $300,849 |
| 2018 | $4,285 | $392,509 | $97,559 | $294,950 |
| 2017 | $4,188 | $384,814 | $95,647 | $289,167 |
| 2016 | $3,924 | $377,272 | $93,773 | $283,499 |
| 2014 | $3,827 | $364,331 | $90,556 | $273,775 |
Source: Public Records
Map
Nearby Homes
- 324 Applewood Dr
- 61 Secret Ct
- 2937 Heritage Oak Way
- 2441 W Elm St
- 922 Pearwood Cir
- 2414 Modoc Way
- 198 Cottage Ln
- 2665 Buttercup Dr
- 2574 Carmelo Ct
- 2312 Burton Way
- 1111 Brighton Way
- 2483 Macarthur Pkwy
- 450 W Turner Rd
- 842 Rutledge Dr
- 2410 Central Park Dr
- 2416 W Turner Rd
- 2402 W Turner Rd
- 2585 Central Park Dr
- 2400 Eilers Ln Unit 1806
- 2400 Eilers Ln Unit 1206
- 2900 Park Oak Dr
- 2916 Park Oak Dr
- 2816 Park Oak Dr
- 2924 Park Oak Dr
- 2909 Park Oak Dr
- 303 Cork Oak Way
- 2917 Park Oak Dr
- 2925 Park Oak Dr
- 2808 Park Oak Dr
- 2932 Park Oak Dr
- 302 Cork Oak Way
- 2912 Fernwood Dr
- 2933 Park Oak Dr
- 2920 Fernwood Dr
- 317 Cork Oak Way
- 310 Cork Oak Way
- 2928 Fernwood Dr
- 219 Evergreen Dr
- 3000 Park Oak Dr
- 2936 Fernwood Dr Unit 49
Your Personal Tour Guide
Ask me questions while you tour the home.