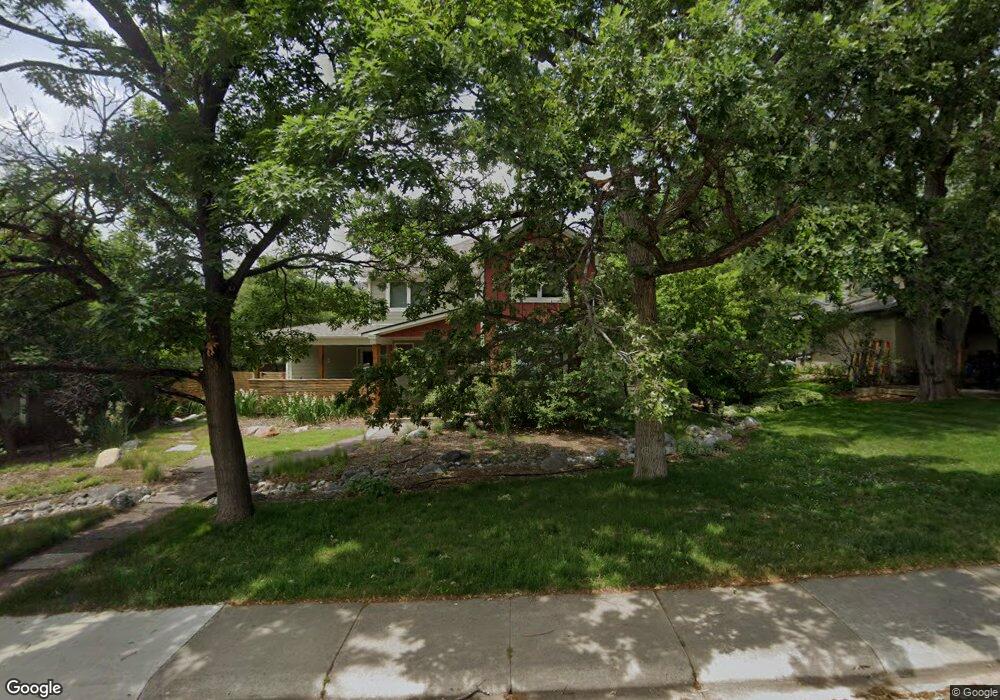
2909 10th St Boulder, CO 80304
Newlands NeighborhoodEstimated Value: $2,227,522 - $2,523,000
4
Beds
4
Baths
2,744
Sq Ft
$856/Sq Ft
Est. Value
About This Home
This home is located at 2909 10th St, Boulder, CO 80304 and is currently estimated at $2,349,131, approximately $856 per square foot. 2909 10th St is a home located in Boulder County with nearby schools including Foothill Elementary School, Casey Middle School, and Boulder High School.
Ownership History
Date
Name
Owned For
Owner Type
Purchase Details
Closed on
Jun 30, 1999
Sold by
Kay Badger Bruce Coleman and Kay Marsha
Bought by
Santos Kari Ann
Current Estimated Value
Home Financials for this Owner
Home Financials are based on the most recent Mortgage that was taken out on this home.
Original Mortgage
$452,000
Outstanding Balance
$123,112
Interest Rate
7.21%
Estimated Equity
$2,226,019
Purchase Details
Closed on
Dec 3, 1986
Bought by
Santos Kari Ann and Santos Theodore Richard
Purchase Details
Closed on
Sep 18, 1986
Bought by
Santos Kari Ann and Santos Theodore Richard
Purchase Details
Closed on
Aug 20, 1979
Bought by
Santos Kari Ann and Santos Theodore Richard
Create a Home Valuation Report for This Property
The Home Valuation Report is an in-depth analysis detailing your home's value as well as a comparison with similar homes in the area
Home Values in the Area
Average Home Value in this Area
Purchase History
| Date | Buyer | Sale Price | Title Company |
|---|---|---|---|
| Santos Kari Ann | $565,000 | -- | |
| Santos Kari Ann | -- | -- | |
| Santos Kari Ann | $94,000 | -- | |
| Santos Kari Ann | $68,500 | -- |
Source: Public Records
Mortgage History
| Date | Status | Borrower | Loan Amount |
|---|---|---|---|
| Open | Santos Kari Ann | $452,000 |
Source: Public Records
Tax History
| Year | Tax Paid | Tax Assessment Tax Assessment Total Assessment is a certain percentage of the fair market value that is determined by local assessors to be the total taxable value of land and additions on the property. | Land | Improvement |
|---|---|---|---|---|
| 2025 | $15,043 | $155,182 | $104,769 | $50,413 |
| 2024 | $15,043 | $155,182 | $104,769 | $50,413 |
| 2023 | $14,782 | $171,165 | $116,118 | $58,732 |
| 2022 | $12,153 | $130,871 | $83,386 | $47,485 |
| 2021 | $11,589 | $134,637 | $85,786 | $48,851 |
| 2020 | $10,181 | $116,960 | $76,005 | $40,955 |
| 2019 | $10,025 | $116,960 | $76,005 | $40,955 |
| 2018 | $8,734 | $100,743 | $60,984 | $39,759 |
| 2017 | $8,461 | $111,376 | $67,421 | $43,955 |
| 2016 | $8,776 | $101,379 | $50,705 | $50,674 |
| 2015 | $8,310 | $84,997 | $35,820 | $49,177 |
| 2014 | $5,756 | $68,456 | $35,820 | $32,636 |
Source: Public Records
Map
Nearby Homes
- 815 Alpine Ave Unit 2
- 3056 8th St
- 1201 Balsam Ave Unit 206
- 2958 6th St
- 2917 13th St
- 1241 Balsam Ave
- 3086 11th St
- 515 Alpine Ave
- 1237 Elder Ave Unit 1
- 653 Dewey Ave
- 3135 11th St
- 1009 Portland Place
- 946 Portland Place
- 900 Portland Place
- 1020 Portland Place
- 501 Evergreen Ave
- 534 Dewey Ave
- 1023 Forest Ave
- 827 Maxwell Ave Unit E
- 3217 Broadway St
Your Personal Tour Guide
Ask me questions while you tour the home.