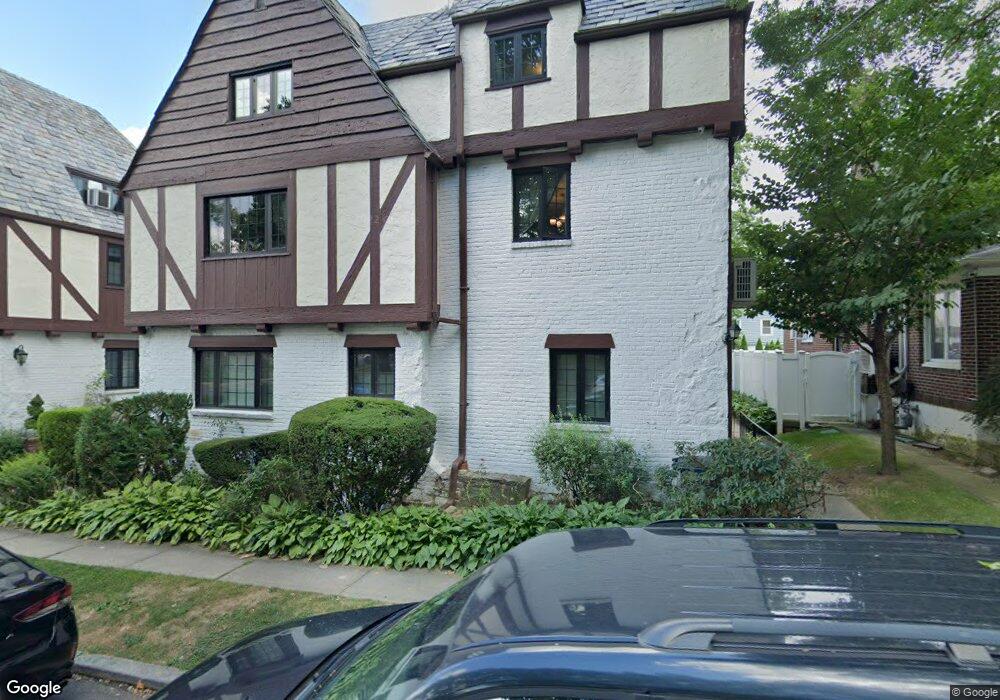
2909 159th St Flushing, NY 11358
Murray Hill-Broadway NeighborhoodEstimated Value: $928,000 - $1,157,000
Studio
--
Bath
1,330
Sq Ft
$802/Sq Ft
Est. Value
About This Home
This home is located at 2909 159th St, Flushing, NY 11358 and is currently estimated at $1,066,667, approximately $802 per square foot. 2909 159th St is a home located in Queens County with nearby schools including P.S. 32 - State Street, I.S. 25 Adrien Block, and Francis Lewis High School.
Ownership History
Date
Name
Owned For
Owner Type
Purchase Details
Closed on
Jul 12, 2004
Sold by
Bonavita Alexander and Bonavita Gia-Ann
Bought by
Bluestar Properties Llc
Current Estimated Value
Purchase Details
Closed on
Oct 30, 2001
Sold by
Johnston Ronald C and Dinapoli Sommai
Bought by
Bonavita Alexander and Bonavita Gia-Ann
Home Financials for this Owner
Home Financials are based on the most recent Mortgage that was taken out on this home.
Original Mortgage
$250,000
Outstanding Balance
$95,141
Interest Rate
6.66%
Estimated Equity
$971,526
Purchase Details
Closed on
Mar 26, 1997
Sold by
Dagounakis Antonios and Frangos Christalla
Bought by
Johnston Ronald C and Dinapoli Sommai
Home Financials for this Owner
Home Financials are based on the most recent Mortgage that was taken out on this home.
Original Mortgage
$228,000
Interest Rate
7.85%
Create a Home Valuation Report for This Property
The Home Valuation Report is an in-depth analysis detailing your home's value as well as a comparison with similar homes in the area
Home Values in the Area
Average Home Value in this Area
Purchase History
| Date | Buyer | Sale Price | Title Company |
|---|---|---|---|
| Bluestar Properties Llc | -- | -- | |
| Bluestar Properties Llc | -- | -- | |
| Bonavita Alexander | -- | -- | |
| Bonavita Alexander | -- | -- | |
| Johnston Ronald C | $240,000 | Stewart Title Insurance Co | |
| Johnston Ronald C | $240,000 | Stewart Title Insurance Co |
Source: Public Records
Mortgage History
| Date | Status | Borrower | Loan Amount |
|---|---|---|---|
| Open | Bonavita Alexander | $250,000 | |
| Closed | Bonavita Alexander | $250,000 | |
| Previous Owner | Johnston Ronald C | $228,000 |
Source: Public Records
Tax History
| Year | Tax Paid | Tax Assessment Tax Assessment Total Assessment is a certain percentage of the fair market value that is determined by local assessors to be the total taxable value of land and additions on the property. | Land | Improvement |
|---|---|---|---|---|
| 2025 | $7,206 | $38,031 | $9,900 | $28,131 |
| 2024 | $7,206 | $35,878 | $9,841 | $26,037 |
| 2023 | $6,874 | $33,847 | $7,841 | $26,006 |
| 2022 | $7,935 | $51,780 | $14,400 | $37,380 |
| 2021 | $7,891 | $52,200 | $14,400 | $37,800 |
| 2020 | $7,916 | $50,220 | $14,400 | $35,820 |
| 2019 | $7,380 | $46,380 | $14,400 | $31,980 |
| 2018 | $6,869 | $33,696 | $9,016 | $24,680 |
| 2017 | $6,752 | $33,122 | $10,050 | $23,072 |
| 2016 | $6,247 | $33,122 | $10,050 | $23,072 |
| 2015 | $3,769 | $31,164 | $15,129 | $16,035 |
| 2014 | $3,769 | $29,400 | $16,020 | $13,380 |
Source: Public Records
Map
Nearby Homes
- 29-09A 159th St
- 2909A 159th St
- 29-07 159th St Unit 1 Fl
- 29-07 159th St
- 29-01A 159th St
- 2901A 159th St
- 2901B 159th St
- 29-03A 159th St
- 29-01B 159th St
- 2903 159th St
- 2905 159th St
- 2907 159th St
- 2911 159th St
- 29-07A 159th St
- 2903A 159th St
- 15912 29th Ave
- 2919 159th St
- 2918 160th St
- 2904 160th St
- 2921 159th St
Your Personal Tour Guide
Ask me questions while you tour the home.