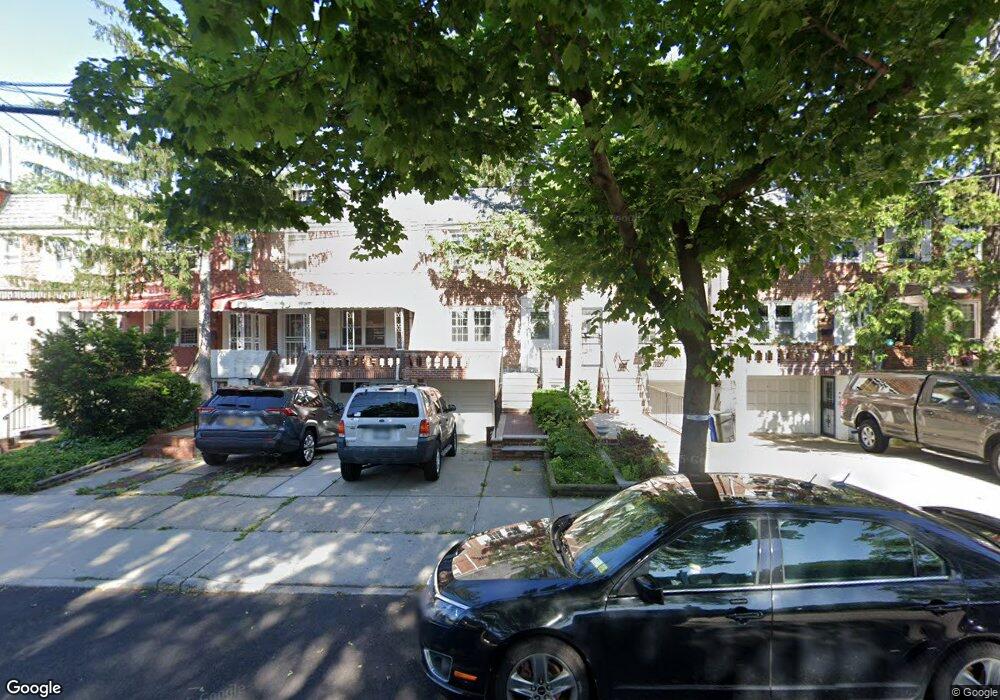
2909 163rd St Flushing, NY 11358
Murray Hill-Broadway NeighborhoodEstimated Value: $917,000 - $974,000
Studio
--
Bath
1,530
Sq Ft
$616/Sq Ft
Est. Value
About This Home
This home is located at 2909 163rd St, Flushing, NY 11358 and is currently estimated at $942,848, approximately $616 per square foot. 2909 163rd St is a home located in Queens County with nearby schools including P.S. 32 - State Street, I.S. 25 Adrien Block, and Francis Lewis High School.
Ownership History
Date
Name
Owned For
Owner Type
Purchase Details
Closed on
Jan 13, 2015
Sold by
Bai Lian Fen
Bought by
Bai Lian Fen and Wu Xingzou
Current Estimated Value
Purchase Details
Closed on
Jun 20, 2014
Sold by
Hsbc Bank Usa N A Successor In Interes
Bought by
Bai Lian Fen
Purchase Details
Closed on
Feb 20, 1998
Sold by
Kravitz Ellyn S and Ungar Murray
Bought by
Marine Midland Bank and Richard Ungar Supplemental Needs Trust
Create a Home Valuation Report for This Property
The Home Valuation Report is an in-depth analysis detailing your home's value as well as a comparison with similar homes in the area
Home Values in the Area
Average Home Value in this Area
Purchase History
| Date | Buyer | Sale Price | Title Company |
|---|---|---|---|
| Bai Lian Fen | -- | -- | |
| Bai Lian Fen | $520,000 | -- | |
| Marine Midland Bank | -- | Ticor Title Guarantee Compan |
Source: Public Records
Tax History
| Year | Tax Paid | Tax Assessment Tax Assessment Total Assessment is a certain percentage of the fair market value that is determined by local assessors to be the total taxable value of land and additions on the property. | Land | Improvement |
|---|---|---|---|---|
| 2025 | $7,675 | $41,275 | $12,579 | $28,696 |
| 2024 | $7,687 | $39,611 | $12,314 | $27,297 |
| 2023 | $7,486 | $38,263 | $10,671 | $27,592 |
| 2022 | $5,192 | $54,660 | $15,780 | $38,880 |
| 2021 | $6,943 | $46,560 | $15,780 | $30,780 |
| 2020 | $6,985 | $49,380 | $15,780 | $33,600 |
| 2019 | $6,612 | $50,280 | $15,780 | $34,500 |
| 2018 | $6,202 | $31,886 | $12,242 | $19,644 |
| 2017 | $5,836 | $30,097 | $12,524 | $17,573 |
| 2016 | $5,420 | $30,097 | $12,524 | $17,573 |
| 2015 | $3,425 | $28,663 | $12,567 | $16,096 |
| 2014 | $3,425 | $27,508 | $14,473 | $13,035 |
Source: Public Records
Map
Nearby Homes
- 29-42 164th St
- 29-35 162nd St
- 2724 166th St
- 2934 161st St
- 16407 27th Ave
- 16608 29th Ave
- 32-15 161st St
- 16042 26th Ave
- 32-35 164th St
- 15911 29th Ave
- 164-04 33rd Ave
- 29-37 168th St
- 27-25 168th St
- 15743 27th Ave
- 29 Avenue
- 3326 162nd St
- 24-44 163rd St
- 25-26 Bayside Ln
- 3226 158th St
- 2533 Francis Lewis Blvd
Your Personal Tour Guide
Ask me questions while you tour the home.