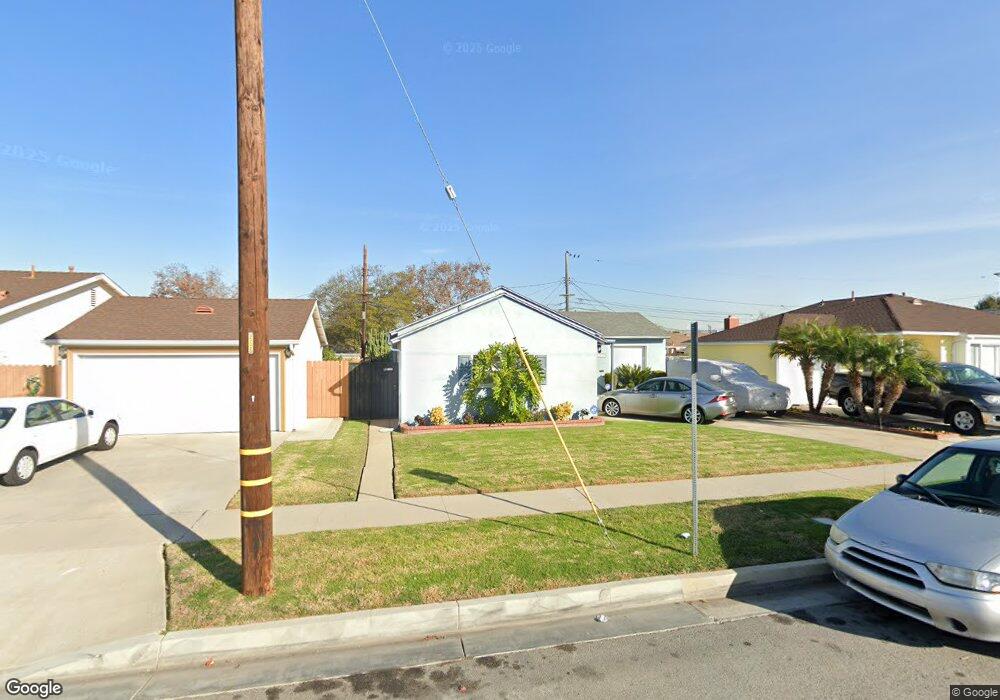
2909 W 147th St Gardena, CA 90249
Estimated Value: $712,000 - $847,000
2
Beds
1
Bath
845
Sq Ft
$925/Sq Ft
Est. Value
About This Home
This home is located at 2909 W 147th St, Gardena, CA 90249 and is currently estimated at $781,532, approximately $924 per square foot. 2909 W 147th St is a home located in Los Angeles County with nearby schools including Chapman Elementary School, Robert E. Peary Middle School, and Gardena Senior High School.
Ownership History
Date
Name
Owned For
Owner Type
Purchase Details
Closed on
Aug 18, 2003
Sold by
Claytor Debra A
Bought by
Claytor Fred L and Claytor Debra A
Current Estimated Value
Home Financials for this Owner
Home Financials are based on the most recent Mortgage that was taken out on this home.
Original Mortgage
$165,000
Outstanding Balance
$32,588
Interest Rate
5.46%
Mortgage Type
Purchase Money Mortgage
Estimated Equity
$748,944
Purchase Details
Closed on
Aug 26, 1999
Sold by
Claytor Fred Lee
Bought by
Claytor Debra A
Home Financials for this Owner
Home Financials are based on the most recent Mortgage that was taken out on this home.
Original Mortgage
$147,250
Interest Rate
7.47%
Purchase Details
Closed on
Jul 21, 1999
Sold by
Hebert Debra
Bought by
Claytor Debra A
Home Financials for this Owner
Home Financials are based on the most recent Mortgage that was taken out on this home.
Original Mortgage
$147,250
Interest Rate
7.47%
Purchase Details
Closed on
Feb 18, 1998
Sold by
Thorpes James A
Bought by
Hebert Debra
Purchase Details
Closed on
Dec 16, 1995
Sold by
Thorpes James A
Bought by
Thorpes James Albert and The Jamesa Thorpes Jr Living Trust
Create a Home Valuation Report for This Property
The Home Valuation Report is an in-depth analysis detailing your home's value as well as a comparison with similar homes in the area
Home Values in the Area
Average Home Value in this Area
Purchase History
| Date | Buyer | Sale Price | Title Company |
|---|---|---|---|
| Claytor Fred L | -- | Chicago Title Co | |
| Claytor Debra A | -- | First American | |
| Claytor Debra A | $155,000 | First American Title Co | |
| Hebert Debra | -- | -- | |
| Thorpes James Albert | -- | Gateway Title Company |
Source: Public Records
Mortgage History
| Date | Status | Borrower | Loan Amount |
|---|---|---|---|
| Open | Claytor Fred L | $165,000 | |
| Closed | Claytor Debra A | $147,250 |
Source: Public Records
Tax History
| Year | Tax Paid | Tax Assessment Tax Assessment Total Assessment is a certain percentage of the fair market value that is determined by local assessors to be the total taxable value of land and additions on the property. | Land | Improvement |
|---|---|---|---|---|
| 2025 | $3,725 | $289,925 | $190,572 | $99,353 |
| 2024 | $3,725 | $284,241 | $186,836 | $97,405 |
| 2023 | $3,658 | $278,669 | $183,173 | $95,496 |
| 2022 | $3,478 | $273,206 | $179,582 | $93,624 |
| 2021 | $3,438 | $267,850 | $176,061 | $91,789 |
| 2019 | $3,325 | $259,907 | $170,840 | $89,067 |
| 2018 | $3,246 | $254,812 | $167,491 | $87,321 |
| 2016 | $3,102 | $244,919 | $160,988 | $83,931 |
| 2015 | $3,049 | $241,241 | $158,570 | $82,671 |
| 2014 | $3,050 | $236,516 | $155,464 | $81,052 |
Source: Public Records
Map
Nearby Homes
- 14751 Wadkins Ave
- 14623 Roxton Ave
- 2807 W 143rd Place
- 14324 Chadron Ave
- 3129 Marine Ave Unit 7
- 3225 W Rosecrans Ave
- 14012 S Wilkie Ave
- 2202 W 144th St
- 15243 Casimir Ave
- 15316 Atkinson Ave
- 13957 Lemoli Ave
- 2116 Marine Ave
- 14405 Cerise Ave Unit 13
- 13717 Casimir Ave
- 14012 Cerise Ave Unit 3
- 2174 Pearl Walk
- 14110 Yukon Ave
- 2824 W 156th St Unit 2
- 2824 W 156th St
- 2032 W 154th St
- 2903 W 147th St
- 14616 Wadkins Ave
- 14610 Wadkins Ave
- 2816 W 146th St
- 2821 W 147th St
- 2812 W 146th St
- 14602 Wadkins Ave
- 14701 Miller Ave
- 2806 W 146th St
- 2817 W 147th St
- 14700 Wadkins Ave
- 2802 W 146th St
- 14717 Miller Ave
- 14716 Wadkins Ave
- 2811 W 147th St
- 14700 Miller Ave
- 14613 Wadkins Ave
- 14619 Wadkins Ave
- 4716 W 146th St
- 14609 Wadkins Ave
Your Personal Tour Guide
Ask me questions while you tour the home.