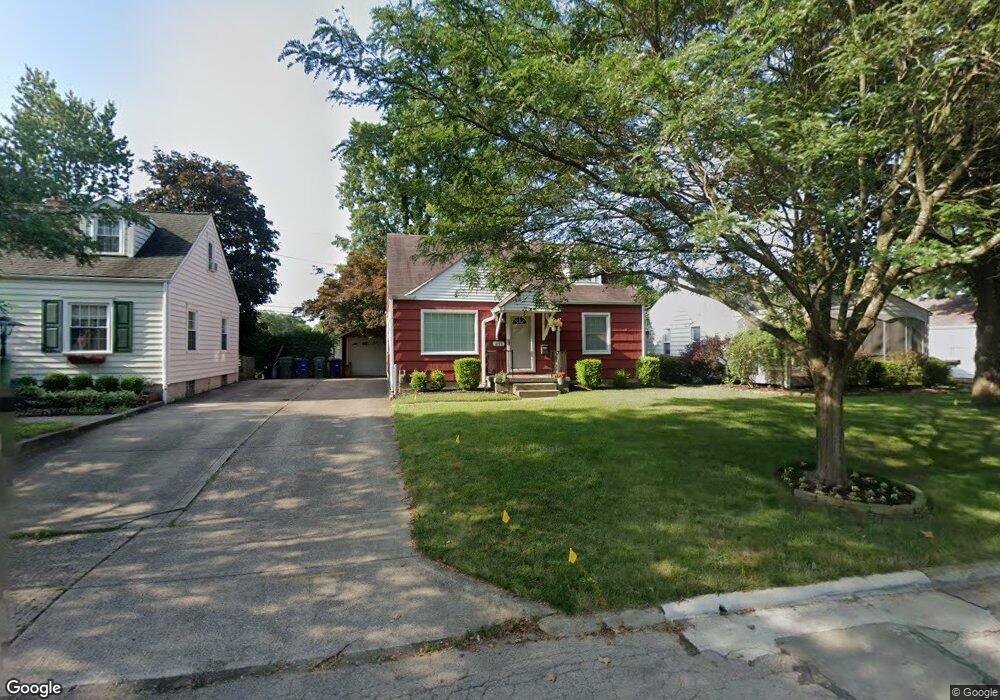
291 E Weisheimer Rd Columbus, OH 43214
Clintonville NeighborhoodEstimated Value: $333,495 - $425,000
3
Beds
2
Baths
1,110
Sq Ft
$339/Sq Ft
Est. Value
About This Home
This home is located at 291 E Weisheimer Rd, Columbus, OH 43214 and is currently estimated at $376,374, approximately $339 per square foot. 291 E Weisheimer Rd is a home located in Franklin County with nearby schools including Indian Springs Elementary School, Dominion Middle School, and Whetstone High School.
Ownership History
Date
Name
Owned For
Owner Type
Purchase Details
Closed on
May 27, 2009
Sold by
Simpson Ruby
Bought by
Wilson Timyra R
Current Estimated Value
Home Financials for this Owner
Home Financials are based on the most recent Mortgage that was taken out on this home.
Original Mortgage
$163,000
Outstanding Balance
$101,594
Interest Rate
4.84%
Mortgage Type
Purchase Money Mortgage
Estimated Equity
$274,780
Purchase Details
Closed on
Apr 30, 2002
Sold by
Reed James W and Estate Of Donna J Reed
Bought by
Simpson Ruby
Home Financials for this Owner
Home Financials are based on the most recent Mortgage that was taken out on this home.
Original Mortgage
$89,000
Interest Rate
6.68%
Mortgage Type
Purchase Money Mortgage
Purchase Details
Closed on
Oct 17, 1978
Bought by
Reed Donna J
Create a Home Valuation Report for This Property
The Home Valuation Report is an in-depth analysis detailing your home's value as well as a comparison with similar homes in the area
Home Values in the Area
Average Home Value in this Area
Purchase History
We collect this data history from publicly available records. To have your information removed, we recommend requesting removal directly through your county’s website.
| Date | Buyer | Sale Price | Title Company |
|---|---|---|---|
| Wilson Timyra R | $164,000 | Attorney | |
| Simpson Ruby | $155,000 | Chicago Title | |
| Reed Donna J | -- | -- |
Source: Public Records
Mortgage History
We collect this data history from publicly available records. To have your information removed, we recommend requesting removal directly through your county’s website.
| Date | Status | Borrower | Loan Amount |
|---|---|---|---|
| Open | Wilson Timyra R | $163,000 | |
| Previous Owner | Simpson Ruby | $89,000 |
Source: Public Records
Tax History
| Year | Tax Paid | Tax Assessment Tax Assessment Total Assessment is a certain percentage of the fair market value that is determined by local assessors to be the total taxable value of land and additions on the property. | Land | Improvement |
|---|---|---|---|---|
| 2025 | $4,382 | $97,650 | $45,640 | $52,010 |
| 2024 | $4,382 | $97,650 | $45,640 | $52,010 |
| 2023 | $4,327 | $97,650 | $45,640 | $52,010 |
| 2022 | $4,076 | $78,580 | $32,550 | $46,030 |
| 2021 | $4,083 | $78,580 | $32,550 | $46,030 |
| 2020 | $4,088 | $78,580 | $32,550 | $46,030 |
| 2019 | $3,671 | $60,520 | $25,030 | $35,490 |
| 2018 | $3,581 | $60,520 | $25,030 | $35,490 |
| 2017 | $3,669 | $60,520 | $25,030 | $35,490 |
| 2016 | $3,853 | $58,170 | $18,620 | $39,550 |
| 2015 | $3,498 | $58,170 | $18,620 | $39,550 |
| 2014 | $3,507 | $58,170 | $18,620 | $39,550 |
| 2013 | $1,647 | $55,405 | $17,745 | $37,660 |
Source: Public Records
Map
Nearby Homes
- 199 E Weisheimer Rd
- 4381 Ingham Ave
- 175 E Weisheimer Rd
- 154 Desantis Dr
- 343 Wetmore Rd
- 289 E Royal Forest Blvd
- 445 Fairlawn Dr
- 495 E Beechwold Blvd
- 451 Fairlawn Dr
- 607 E Weisheimer Rd
- 522 E Beechwold Blvd
- 528 E Beechwold Blvd
- 392 E Jeffrey Place
- 165 Morse Rd
- 60 W Schreyer Place
- 111 Morse Rd
- 99 Indian Springs Dr
- 4457 Rosemary Pkwy
- 4896 Elks Dr
- 4405 Rosemary Pkwy
- 299 E Weisheimer Rd
- 285 E Weisheimer Rd
- 305 E Weisheimer Rd
- 277 E Weisheimer Rd
- 315 E Weisheimer Rd
- 280 Dixon Ct
- 267 E Weisheimer Rd
- 292 E Weisheimer Rd
- 288 E Weisheimer Rd
- 274 Dixon Ct
- 306 E Weisheimer Rd
- 278 E Weisheimer Rd
- 321 E Weisheimer Rd
- 263 E Weisheimer Rd
- 272 E Weisheimer Rd
- 266 Dixon Ct
- 316 E Weisheimer Rd
- 266 E Weisheimer Rd
- 329 E Weisheimer Rd
- 260 Dixon Ct
Your Personal Tour Guide
Ask me questions while you tour the home.