Estimated Value: $172,952 - $233,000
3
Beds
1
Bath
960
Sq Ft
$203/Sq Ft
Est. Value
About This Home
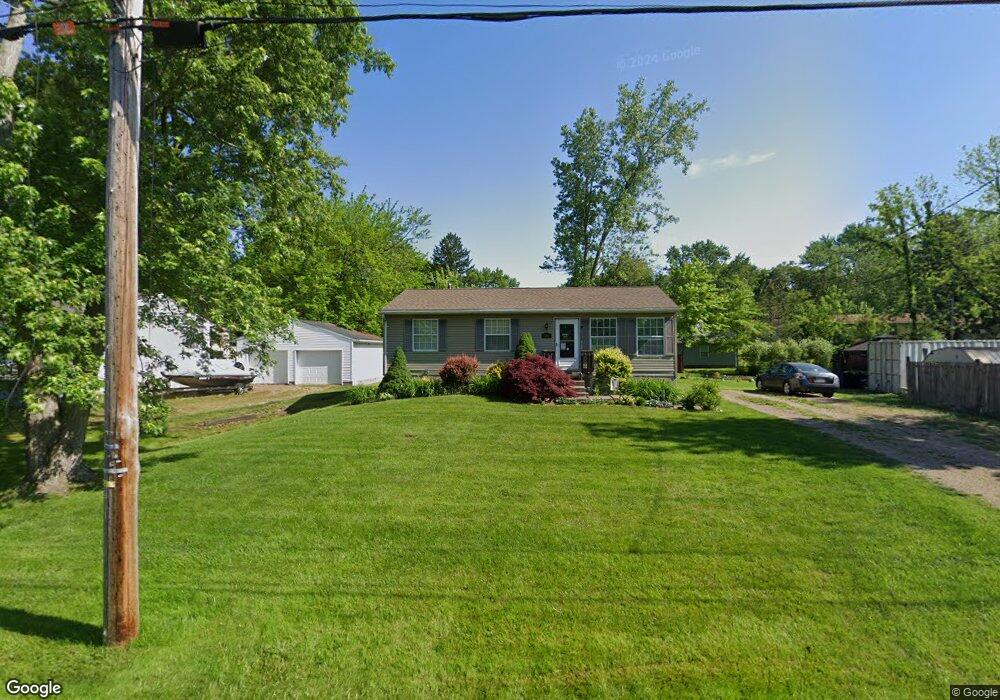
This home is located at 291 Hottle St, Akron, OH 44319 and is currently estimated at $194,988, approximately $203 per square foot. 291 Hottle St is a home located in Summit County with nearby schools including Coventry Middle School, Coventry High School, and St. Francis de Sales School.
Ownership History
Date
Name
Owned For
Owner Type
Purchase Details
Closed on
Dec 1, 2023
Sold by
Snider Dwight W
Bought by
Snider Laurie D and Snider Dwight W
Current Estimated Value
Purchase Details
Closed on
Nov 30, 2023
Sold by
Snider Dwight W
Bought by
Snider Laurie D and Snider Dwight W
Purchase Details
Closed on
Jul 9, 2008
Sold by
Snider Rosemary E
Bought by
Snider Dwight W
Purchase Details
Closed on
May 12, 2004
Sold by
Federal Home Loan Mortgage Corporation
Bought by
Snider Dwight W and Snider Rosemary E
Home Financials for this Owner
Home Financials are based on the most recent Mortgage that was taken out on this home.
Original Mortgage
$95,968
Interest Rate
6.37%
Mortgage Type
FHA
Purchase Details
Closed on
Sep 17, 2003
Sold by
Dickey Michael L
Bought by
Federal Home Loan Mortgage Corporation
Create a Home Valuation Report for This Property
The Home Valuation Report is an in-depth analysis detailing your home's value as well as a comparison with similar homes in the area
Home Values in the Area
Average Home Value in this Area
Purchase History
| Date | Buyer | Sale Price | Title Company |
|---|---|---|---|
| Snider Laurie D | -- | None Listed On Document | |
| Snider Laurie D | -- | None Listed On Document | |
| Snider Dwight W | -- | Attorney | |
| Snider Dwight W | -- | -- | |
| Federal Home Loan Mortgage Corporation | $70,000 | -- |
Source: Public Records
Mortgage History
| Date | Status | Borrower | Loan Amount |
|---|---|---|---|
| Previous Owner | Snider Dwight W | $95,968 |
Source: Public Records
Tax History
| Year | Tax Paid | Tax Assessment Tax Assessment Total Assessment is a certain percentage of the fair market value that is determined by local assessors to be the total taxable value of land and additions on the property. | Land | Improvement |
|---|---|---|---|---|
| 2025 | $3,457 | $44,892 | $8,124 | $36,768 |
| 2024 | $3,457 | $44,892 | $8,124 | $36,768 |
| 2023 | $3,457 | $44,892 | $8,124 | $36,768 |
| 2022 | $3,278 | $34,535 | $6,251 | $28,284 |
| 2021 | $3,133 | $34,535 | $6,251 | $28,284 |
| 2020 | $3,066 | $34,530 | $6,250 | $28,280 |
| 2019 | $2,834 | $28,170 | $7,770 | $20,400 |
| 2018 | $2,815 | $28,170 | $7,770 | $20,400 |
| 2017 | $2,631 | $28,170 | $7,770 | $20,400 |
| 2016 | $2,520 | $23,920 | $7,770 | $16,150 |
| 2015 | $2,631 | $23,920 | $7,770 | $16,150 |
| 2014 | $2,584 | $23,920 | $7,770 | $16,150 |
| 2013 | $3,018 | $30,680 | $7,770 | $22,910 |
Source: Public Records
Map
Nearby Homes
- 206 Olivet Ave
- 196 Olivet Ave
- 156 W Ingleside Dr
- 173 Portage Lakes Dr
- 449 W Long Lake Blvd
- 202 W Warner Rd
- 686 Portage Lakes Dr
- 0 W Warner Rd
- 796 Portage Lakes Dr
- 72 Weil Ave
- 253 Aqua Blvd
- 584 Apple Dr
- 3545 Malley Ave
- 61 Leicester Dr
- 2679 N Bender Ave
- 3025 Lamb Dr
- 2813 N Bender Ave
- 3782 Edgepark Dr
- 543 Idalia Ave
- 3462 Dollar Dr
- 299 Hottle St
- 275 Hottle St
- 305 Hottle St
- 310 Hohman Ave
- 288 Hohman Ave
- 300 Hohman Ave
- 294 Hohman Ave
- 276 Hohman Ave
- 290 Hottle St
- 316 Hohman Ave
- 284 Hottle St
- 296 Hottle St
- 311 Hottle St
- 266 Hohman Ave
- 3085 Wagoner St
- 310 Hottle St
- 3091 Wagoner St
- 3076 N 3076 Turkeyfoot Rd
- 316 Hottle St
- 3070 N Turkeyfoot Rd
Your Personal Tour Guide
Ask me questions while you tour the home.