291 Par Ave Redway, CA 95560
Estimated Value: $307,000 - $371,655
About This Home
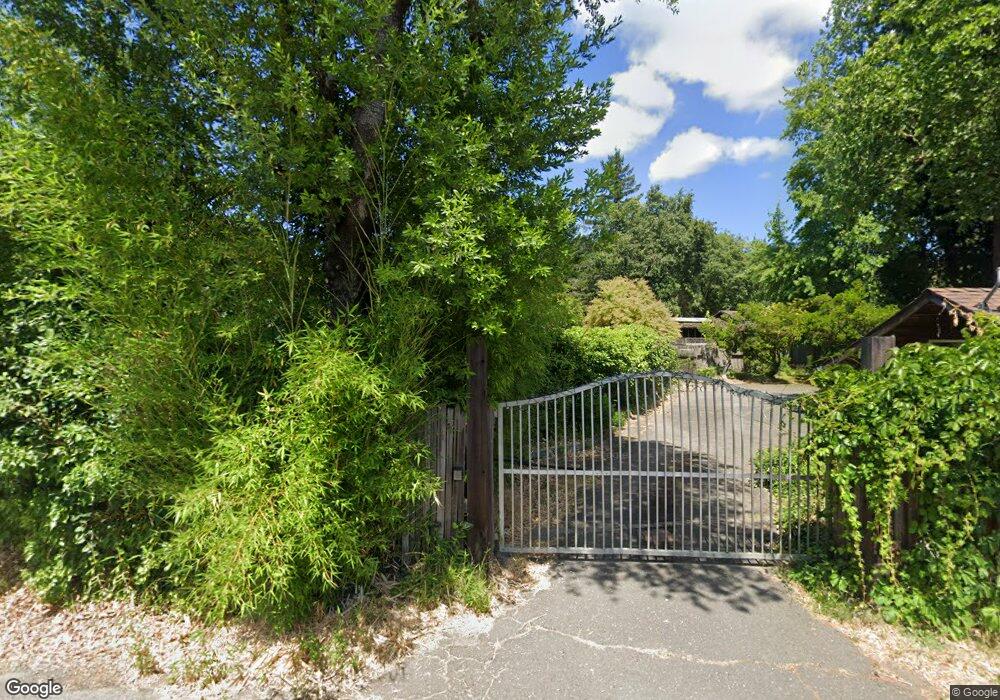
This home is located at 291 Par Ave, Redway, CA 95560 and is currently estimated at $330,218. 291 Par Ave is a home.
Ownership History
We collect this data history from publicly available records. To have your information removed, we recommend requesting removal directly through your county’s website.
Purchase Details
Purchase Details
Home Financials for this Owner
Home Financials are based on the most recent Mortgage that was taken out on this home.Purchase Details
Home Financials for this Owner
Home Financials are based on the most recent Mortgage that was taken out on this home.Purchase Details
Home Values in the Area
Average Home Value in this Area
Purchase History
We collect this data history from publicly available records. To have your information removed, we recommend requesting removal directly through your county’s website.
| Date | Buyer | Sale Price | Title Company |
|---|---|---|---|
| -- | None Available | ||
| -- | Old Republic Title Company | ||
| -- | Old Republic Title Company | ||
| $220,000 | Fidelity National |
Mortgage History
We collect this data history from publicly available records. To have your information removed, we recommend requesting removal directly through your county’s website.
| Date | Status | Borrower | Loan Amount |
|---|---|---|---|
| Open | $165,000 |
Tax History
We collect this data history from publicly available records. To have your information removed, we recommend requesting removal directly through your county’s website.
| Year | Tax Paid | Tax Assessment Tax Assessment Total Assessment is a certain percentage of the fair market value that is determined by local assessors to be the total taxable value of land and additions on the property. | Land | Improvement |
|---|---|---|---|---|
| 2025 | $3,813 | $358,741 | $99,514 | $259,227 |
| 2024 | $3,813 | $351,708 | $97,563 | $254,145 |
| 2023 | $3,827 | $344,812 | $95,650 | $249,162 |
| 2022 | $3,767 | $338,052 | $93,775 | $244,277 |
| 2021 | $3,622 | $331,425 | $91,937 | $239,488 |
| 2020 | $3,643 | $328,028 | $90,995 | $237,033 |
| 2019 | $3,551 | $321,597 | $89,211 | $232,386 |
| 2018 | $3,488 | $315,292 | $87,462 | $227,830 |
| 2017 | $3,421 | $309,111 | $85,748 | $223,363 |
| 2016 | $3,399 | $303,051 | $84,067 | $218,984 |
| 2015 | -- | $298,500 | $82,805 | $215,695 |
| 2014 | -- | $292,653 | $81,183 | $211,470 |
Map
- 282 Par Ave
- 178 Whitmore Ave
- 190 Pine St
- 33 Empire Ave
- 260 Redway Dr
- 220 Orchard Ln
- 64 Pacific Ave
- 44 Mckenzie Ln
- 521 Forest Dr
- 671 Orchard Ln
- 5200 Briceland Rd
- 273 Forest Dr
- 121 Manzanita
- 243 Forest Dr
- 72 W Coast Dr
- 77 Mill Rd
- 2611 Redwood Dr
- 1880 Tunnel Rd
- 4001 Old Briceland Rd
- 1777 Sprowl Creek Rd
Ask me questions while you tour the home.