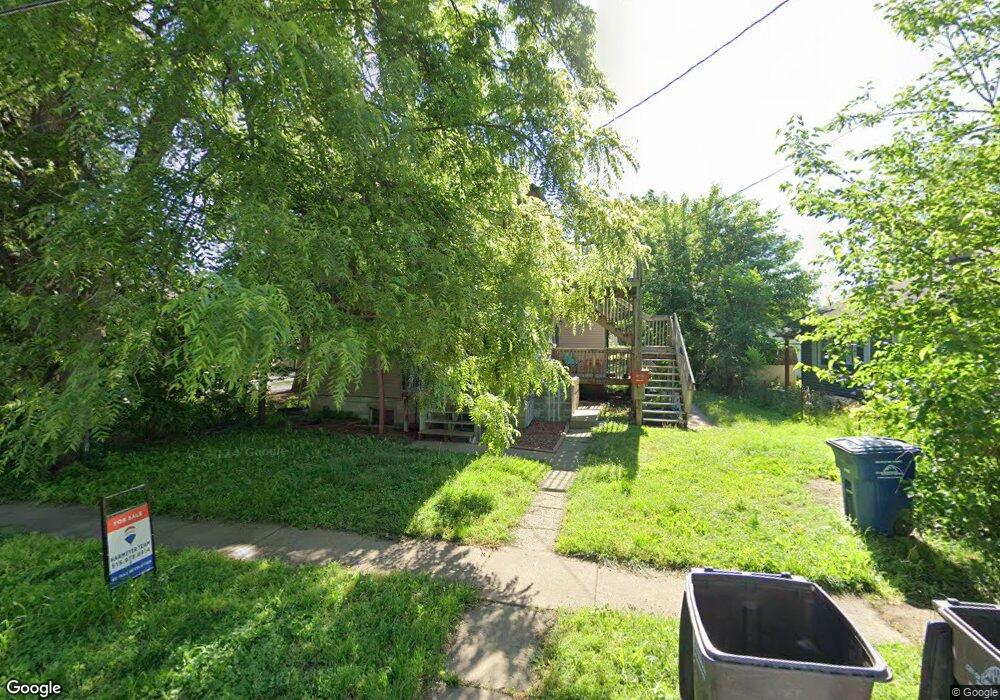
2911 5th Ave Des Moines, IA 50313
Highland Park NeighborhoodEstimated Value: $109,000
--
Bed
2
Baths
1,562
Sq Ft
$70/Sq Ft
Est. Value
About This Home
This home is located at 2911 5th Ave, Des Moines, IA 50313 and is currently estimated at $109,000, approximately $69 per square foot. 2911 5th Ave is a home located in Polk County with nearby schools including Oak Park Elementary School, Harding Middle School, and North High School.
Ownership History
Date
Name
Owned For
Owner Type
Purchase Details
Closed on
Feb 4, 2004
Sold by
Green Tree Servicing Llc
Bought by
Moon Ladondra
Current Estimated Value
Home Financials for this Owner
Home Financials are based on the most recent Mortgage that was taken out on this home.
Original Mortgage
$87,020
Outstanding Balance
$40,639
Interest Rate
5.88%
Mortgage Type
FHA
Estimated Equity
$68,361
Purchase Details
Closed on
Jan 16, 2004
Sold by
Green Tree Serving Llc
Bought by
Green Tree Servicing Llc
Home Financials for this Owner
Home Financials are based on the most recent Mortgage that was taken out on this home.
Original Mortgage
$87,020
Outstanding Balance
$40,639
Interest Rate
5.88%
Mortgage Type
FHA
Estimated Equity
$68,361
Purchase Details
Closed on
Dec 5, 2002
Sold by
Hatfield David A and Hatfield Jacquelyn S
Bought by
Conseco Finance Servicing Corp
Create a Home Valuation Report for This Property
The Home Valuation Report is an in-depth analysis detailing your home's value as well as a comparison with similar homes in the area
Home Values in the Area
Average Home Value in this Area
Purchase History
| Date | Buyer | Sale Price | Title Company |
|---|---|---|---|
| Moon Ladondra | $30,500 | -- | |
| Green Tree Servicing Llc | -- | -- | |
| Conseco Finance Servicing Corp | $50,698 | -- |
Source: Public Records
Mortgage History
| Date | Status | Borrower | Loan Amount |
|---|---|---|---|
| Open | Moon Ladondra | $87,020 |
Source: Public Records
Tax History Compared to Growth
Tax History
| Year | Tax Paid | Tax Assessment Tax Assessment Total Assessment is a certain percentage of the fair market value that is determined by local assessors to be the total taxable value of land and additions on the property. | Land | Improvement |
|---|---|---|---|---|
| 2025 | $1,370 | $75,200 | $18,700 | $56,500 |
| 2024 | $1,370 | $69,600 | $16,400 | $53,200 |
| 2023 | $1,334 | $69,600 | $16,400 | $53,200 |
| 2022 | $1,560 | $56,600 | $13,700 | $42,900 |
| 2021 | $1,386 | $56,600 | $13,700 | $42,900 |
| 2020 | $1,815 | $46,400 | $12,500 | $33,900 |
| 2019 | $1,585 | $46,400 | $12,500 | $33,900 |
| 2018 | $2,096 | $38,500 | $12,500 | $26,000 |
| 2017 | $1,547 | $38,500 | $12,500 | $26,000 |
| 2016 | $1,939 | $35,000 | $10,400 | $24,600 |
| 2015 | $1,430 | $35,000 | $10,400 | $24,600 |
| 2014 | $1,783 | $31,000 | $10,400 | $20,600 |
Source: Public Records
Map
Nearby Homes