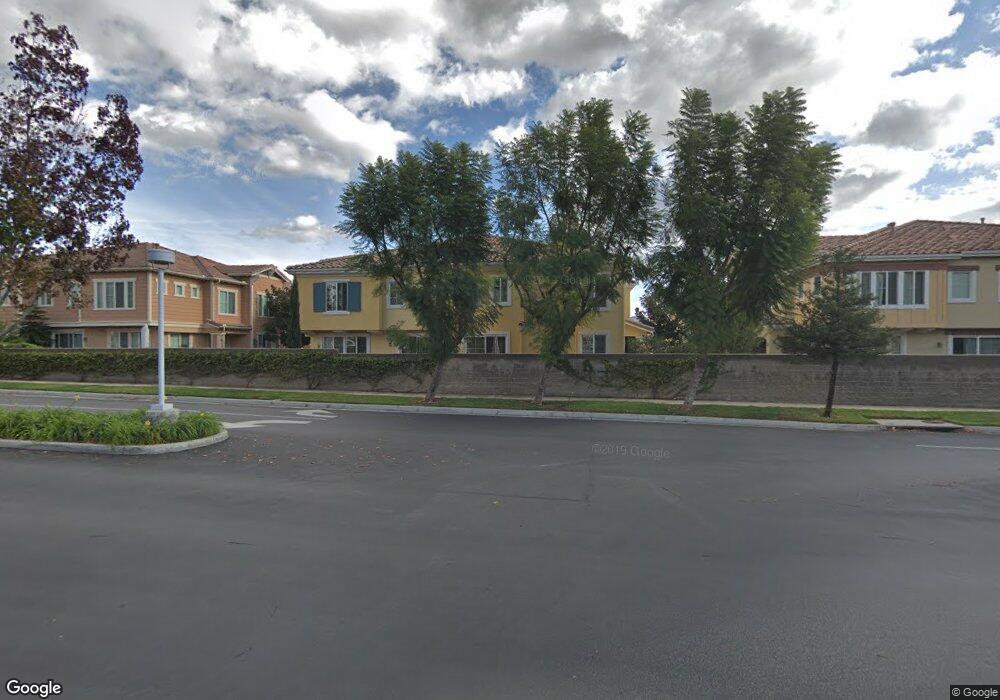
2911 Esperanza Way Unit A Simi Valley, CA 93063
Central Simi Valley NeighborhoodEstimated Value: $639,000 - $698,000
2
Beds
2
Baths
1,373
Sq Ft
$480/Sq Ft
Est. Value
About This Home
This home is located at 2911 Esperanza Way Unit A, Simi Valley, CA 93063 and is currently estimated at $658,574, approximately $479 per square foot. 2911 Esperanza Way Unit A is a home located in Ventura County with nearby schools including Township Elementary School, Valley View Middle School, and Simi Valley High School.
Ownership History
Date
Name
Owned For
Owner Type
Purchase Details
Closed on
Jun 7, 2021
Sold by
Judd Kevin R and Judd Nicole M
Bought by
Judd Kevin R and Judd Nicole M
Current Estimated Value
Purchase Details
Closed on
Feb 4, 2016
Sold by
Judd Nicole M and Funfar Nicole
Bought by
Judd Kevin R and Judd Nicole M
Home Financials for this Owner
Home Financials are based on the most recent Mortgage that was taken out on this home.
Original Mortgage
$276,000
Outstanding Balance
$170,225
Interest Rate
3.92%
Mortgage Type
New Conventional
Estimated Equity
$488,349
Purchase Details
Closed on
Nov 24, 2004
Sold by
Shea Homes Lp
Bought by
Funfar Nicole
Home Financials for this Owner
Home Financials are based on the most recent Mortgage that was taken out on this home.
Original Mortgage
$317,400
Interest Rate
5.5%
Mortgage Type
Purchase Money Mortgage
Create a Home Valuation Report for This Property
The Home Valuation Report is an in-depth analysis detailing your home's value as well as a comparison with similar homes in the area
Home Values in the Area
Average Home Value in this Area
Purchase History
| Date | Buyer | Sale Price | Title Company |
|---|---|---|---|
| Judd Kevin R | -- | None Available | |
| Judd Kevin R | -- | Consumers Title Company | |
| Funfar Nicole | $397,000 | Chicago Title Co |
Source: Public Records
Mortgage History
| Date | Status | Borrower | Loan Amount |
|---|---|---|---|
| Open | Judd Kevin R | $276,000 | |
| Closed | Funfar Nicole | $317,400 | |
| Closed | Funfar Nicole | $19,800 |
Source: Public Records
Tax History Compared to Growth
Tax History
| Year | Tax Paid | Tax Assessment Tax Assessment Total Assessment is a certain percentage of the fair market value that is determined by local assessors to be the total taxable value of land and additions on the property. | Land | Improvement |
|---|---|---|---|---|
| 2025 | $6,732 | $553,095 | $276,549 | $276,546 |
| 2024 | $6,732 | $542,250 | $271,126 | $271,124 |
| 2023 | $6,330 | $531,618 | $265,810 | $265,808 |
| 2022 | $6,311 | $521,195 | $260,598 | $260,597 |
| 2021 | $6,272 | $510,976 | $255,488 | $255,488 |
| 2020 | $6,145 | $505,738 | $252,869 | $252,869 |
| 2019 | $5,866 | $495,822 | $247,911 | $247,911 |
| 2018 | $5,579 | $464,000 | $230,000 | $234,000 |
| 2017 | $5,316 | $442,000 | $219,000 | $223,000 |
| 2016 | $4,795 | $407,000 | $202,000 | $205,000 |
| 2015 | $4,460 | $386,000 | $192,000 | $194,000 |
| 2014 | $4,238 | $364,000 | $181,000 | $183,000 |
Source: Public Records
Map
Nearby Homes
- 2964 Camelita Way Unit C
- 4460 Lubbock Dr Unit B
- 4321 Apricot Rd
- 3194 Granville Ave
- 3690 Valencia Ave
- 3265 Sheri Dr
- 3235 Amarillo Ave
- 2782 Lemon Dr
- 3008 Cisco Ct
- 3307 Cole Ave
- 2250 N Goddard Ave
- 3239 Hamlin Ave
- 4141 Eileen St
- 2945 Dalhart Ave
- 3998 Celia Ct
- 4790 Adam Rd
- 2439 Lita Place
- 3474 Highwood Ct Unit 80
- 3581 Rachael Ave
- 3458 Highwood Ct Unit 198
- 2911 Esperanza Way Unit B
- 2911 Esperanza Way Unit C
- 2917 Esperanza Way Unit C
- 2917 Esperanza Way Unit A
- 2917 Esperanza Way Unit B
- 2903 Esperanza Way Unit B
- 2903 Esperanza Way Unit A
- 2903 Esperanza Way Unit C
- 2916 Esperanza Way Unit A
- 2916 Esperanza Way Unit F
- 2916 Esperanza Way Unit E
- 2916 Esperanza Way Unit D
- 2916 Esperanza Way Unit C
- 2916 Esperanza Way Unit B
- 4142 Felipe Ln Unit D
- 4142 Felipe Ln Unit C
- 4142 Felipe Ln Unit B
- 4142 Felipe Ln Unit A
- 4142 Felipe Ln Unit E
- 4142 Felipe Ln Unit F