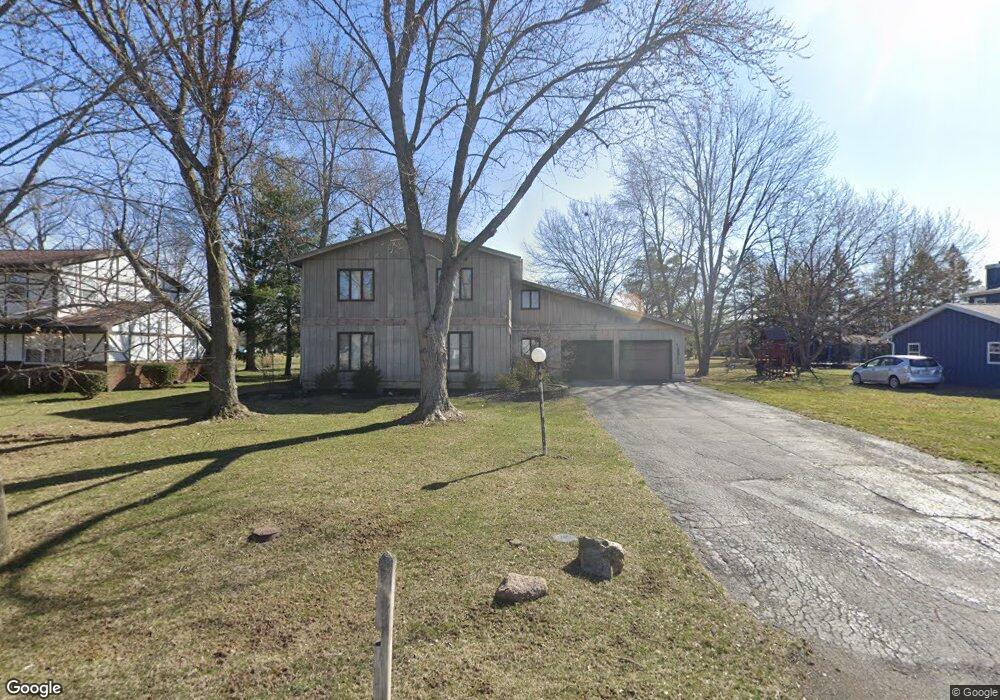
2911 Gleneagle Dr Findlay, OH 45840
Estimated Value: $332,263 - $396,000
4
Beds
3
Baths
2,716
Sq Ft
$138/Sq Ft
Est. Value
About This Home
This home is located at 2911 Gleneagle Dr, Findlay, OH 45840 and is currently estimated at $375,316, approximately $138 per square foot. 2911 Gleneagle Dr is a home located in Hancock County with nearby schools including Liberty-Benton Elementary School, Liberty-Benton Middle School, and Liberty-Benton High School.
Ownership History
Date
Name
Owned For
Owner Type
Purchase Details
Closed on
Feb 23, 2017
Sold by
Lenhart Jeffrey L
Bought by
Lenhart Jeffery L
Current Estimated Value
Purchase Details
Closed on
Jun 13, 2001
Sold by
Quillen Charles
Bought by
Lenhart Jeffrey L
Home Financials for this Owner
Home Financials are based on the most recent Mortgage that was taken out on this home.
Original Mortgage
$156,825
Outstanding Balance
$59,825
Interest Rate
7.16%
Mortgage Type
New Conventional
Estimated Equity
$315,491
Purchase Details
Closed on
May 23, 1997
Sold by
Reiterman Roy
Bought by
Quillen Charles and Quillen Margaret
Home Financials for this Owner
Home Financials are based on the most recent Mortgage that was taken out on this home.
Original Mortgage
$150,750
Interest Rate
8.24%
Mortgage Type
Balloon
Purchase Details
Closed on
Sep 12, 1989
Bought by
Reiterman Roy H and Reiterman Judith L
Purchase Details
Closed on
Sep 10, 1984
Bought by
Stachelhaus Gustav A
Purchase Details
Closed on
Feb 7, 1984
Bought by
Equitable Relocation
Create a Home Valuation Report for This Property
The Home Valuation Report is an in-depth analysis detailing your home's value as well as a comparison with similar homes in the area
Home Values in the Area
Average Home Value in this Area
Purchase History
| Date | Buyer | Sale Price | Title Company |
|---|---|---|---|
| Lenhart Jeffery L | -- | None Available | |
| Lenhart Jeffrey L | $174,250 | -- | |
| Quillen Charles | $167,500 | -- | |
| Reiterman Roy H | $139,000 | -- | |
| Stachelhaus Gustav A | $95,000 | -- | |
| Equitable Relocation | -- | -- |
Source: Public Records
Mortgage History
| Date | Status | Borrower | Loan Amount |
|---|---|---|---|
| Open | Lenhart Jeffrey L | $156,825 | |
| Previous Owner | Quillen Charles | $150,750 |
Source: Public Records
Tax History Compared to Growth
Tax History
| Year | Tax Paid | Tax Assessment Tax Assessment Total Assessment is a certain percentage of the fair market value that is determined by local assessors to be the total taxable value of land and additions on the property. | Land | Improvement |
|---|---|---|---|---|
| 2024 | $2,919 | $76,830 | $10,710 | $66,120 |
| 2023 | $2,852 | $76,830 | $10,710 | $66,120 |
| 2022 | $2,825 | $76,830 | $10,710 | $66,120 |
| 2021 | $2,526 | $60,730 | $10,710 | $50,020 |
| 2020 | $2,547 | $60,730 | $10,710 | $50,020 |
| 2019 | $2,446 | $60,730 | $10,710 | $50,020 |
| 2018 | $1,936 | $52,850 | $9,310 | $43,540 |
| 2017 | $999 | $52,850 | $9,310 | $43,540 |
| 2016 | $1,894 | $52,850 | $9,310 | $43,540 |
| 2015 | $2,089 | $57,030 | $9,310 | $47,720 |
| 2014 | $2,108 | $57,030 | $9,310 | $47,720 |
| 2012 | $2,202 | $57,030 | $9,310 | $47,720 |
Source: Public Records
Map
Nearby Homes
- 3018 Gleneagle Dr
- 3106 Saddlebrook
- 1405 Cypress Lake
- 933 Laurel Ln
- 1310 Muirfield Dr
- 6535 Silver Lake Dr
- 925 W Melrose Ave
- 905 W Melrose Ave
- 3300 Crosshill Dr
- 615 Hillcrest Ave
- 0 County Road 95 Unit 6097574
- 506 Hillcrest Ave
- 643 Edith Ave
- 0 County Road 140
- 0 Township Highway 99
- 12325 Township Highway 99
- 0 Bushwillow Dr Or Rock Candy Rd Unit Lot 157
- 0 Allen Township 142
- 0 Rock Candy Rd Or Bushwillow Dr Unit Lot 173
- 0 Rock Candy Rd Unit Lot 159
- 2917 Gleneagle Dr
- 2907 Gleneagle Dr
- 2923 Gleneagle Dr
- 2901 Gleneagle Dr
- 2910 Gleneagle Dr
- 1124 Inverness Dr
- 2906 Gleneagle Dr
- 2920 Gleneagle Dr
- 2900 Gleneagle Dr
- 2929 Gleneagle Dr
- 1118 Inverness Dr
- 2928 Gleneagle Dr
- 2818 Gleneagle Dr
- 2939 Saddlebrook
- 1139 Inverness Dr
- 2933 Gleneagle Dr
- 2933 Saddlebrook
- 1112 Inverness Dr
- 3001 Saddlebrook
- 1127 Inverness Dr