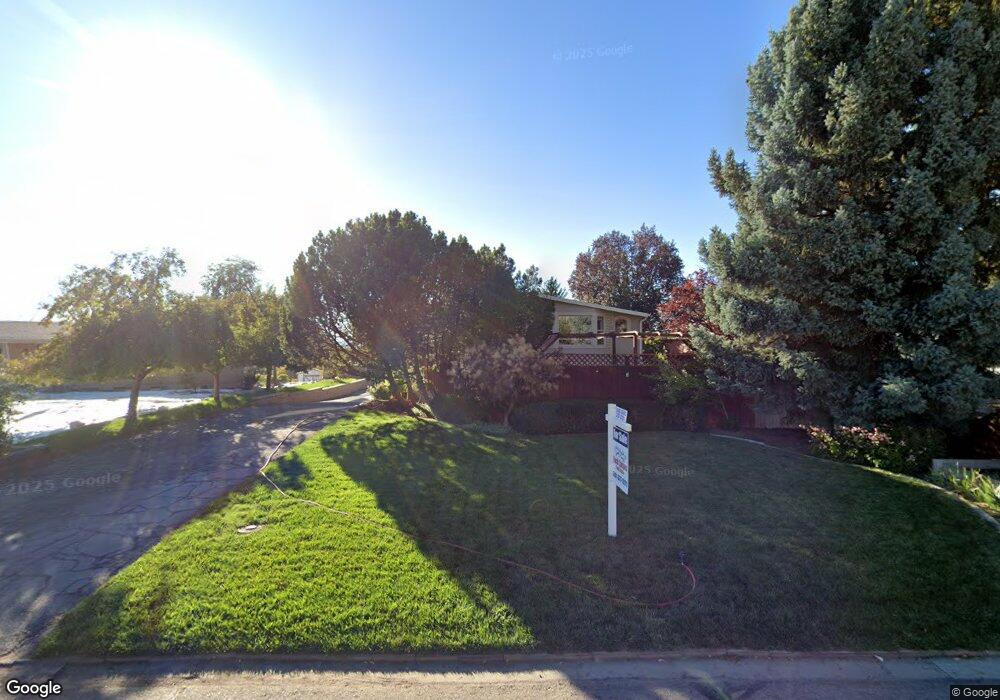
2911 N 175 E Provo, UT 84604
Rock Canyon NeighborhoodEstimated Value: $703,000 - $790,000
5
Beds
3
Baths
4,335
Sq Ft
$175/Sq Ft
Est. Value
About This Home
This home is located at 2911 N 175 E, Provo, UT 84604 and is currently estimated at $759,168, approximately $175 per square foot. 2911 N 175 E is a home located in Utah County with nearby schools including Edgemont School, Centennial Middle School, and Timpview High School.
Ownership History
Date
Name
Owned For
Owner Type
Purchase Details
Closed on
Feb 26, 2024
Sold by
Bradley Brandon and Sinclair Marlayne M
Bought by
Bradley Brandon and Bradley Alexis
Current Estimated Value
Home Financials for this Owner
Home Financials are based on the most recent Mortgage that was taken out on this home.
Original Mortgage
$627,000
Outstanding Balance
$616,023
Interest Rate
6.66%
Mortgage Type
New Conventional
Estimated Equity
$143,145
Purchase Details
Closed on
Feb 22, 2024
Sold by
Elray And Susanne Roper Family Trust
Bought by
Bradley Brandon and Sinclair Marlayne M
Home Financials for this Owner
Home Financials are based on the most recent Mortgage that was taken out on this home.
Original Mortgage
$627,000
Outstanding Balance
$616,023
Interest Rate
6.66%
Mortgage Type
New Conventional
Estimated Equity
$143,145
Purchase Details
Closed on
Apr 9, 2018
Sold by
Roper Eiray M and Roper Elray Merrell
Bought by
Roper Elray Marrell and Olsen Roper Susanne Frost
Purchase Details
Closed on
Nov 19, 2007
Sold by
Horner Bob G and Horner Joan M
Bought by
Roper Elray Merrell and Roper Susanne Olsen
Create a Home Valuation Report for This Property
The Home Valuation Report is an in-depth analysis detailing your home's value as well as a comparison with similar homes in the area
Home Values in the Area
Average Home Value in this Area
Purchase History
| Date | Buyer | Sale Price | Title Company |
|---|---|---|---|
| Bradley Brandon | -- | None Listed On Document | |
| Bradley Brandon | -- | Masters Title | |
| Roper Elray Marrell | -- | None Available | |
| Roper Elray Merrell | -- | Title West Title Company |
Source: Public Records
Mortgage History
| Date | Status | Borrower | Loan Amount |
|---|---|---|---|
| Open | Bradley Brandon | $627,000 |
Source: Public Records
Tax History
| Year | Tax Paid | Tax Assessment Tax Assessment Total Assessment is a certain percentage of the fair market value that is determined by local assessors to be the total taxable value of land and additions on the property. | Land | Improvement |
|---|---|---|---|---|
| 2025 | $3,514 | $377,025 | -- | -- |
| 2024 | $3,514 | $345,895 | $0 | $0 |
| 2023 | $3,337 | $323,840 | $0 | $0 |
| 2022 | $3,210 | $314,105 | $0 | $0 |
| 2021 | $2,517 | $429,500 | $205,400 | $224,100 |
| 2020 | $2,443 | $390,900 | $171,200 | $219,700 |
| 2019 | $2,279 | $379,100 | $171,200 | $207,900 |
| 2018 | $2,158 | $364,200 | $158,300 | $205,900 |
| 2017 | $2,110 | $195,635 | $0 | $0 |
| 2016 | $2,098 | $181,335 | $0 | $0 |
| 2015 | $1,883 | $164,450 | $0 | $0 |
| 2014 | $1,739 | $158,345 | $0 | $0 |
Source: Public Records
Map
Nearby Homes
- 3025 N 250 E
- 3013 N 100 W
- 3057 N 100 W
- 2735 N Country Club Dr
- 2939 N Marrcrest Dr W
- 2999 N Marrcrest West Dr
- 2774 N 370 E
- 3221 Shadowbrook Cir
- 3240 Shadowbrook Dr
- 111 Candlewood Place
- 3305 N Shadowbrook Cir
- 158 Woodside Dr
- 5600 N Canyon Rd
- 758 E 3030 N
- 240 E 2230 N Unit 7
- 2254 N 390 E
- 788 E 2680 N
- 223 W 2230 N Unit 14
- 3129 Cherokee Ln
- 241 W 2230 N Unit 16
Your Personal Tour Guide
Ask me questions while you tour the home.