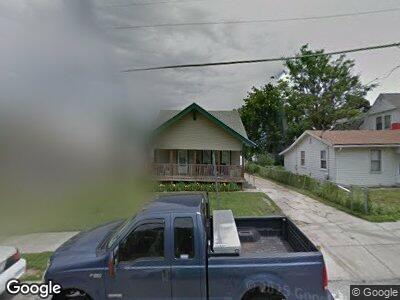
2911 N 45th St Omaha, NE 68104
Clifton Hills NeighborhoodEstimated Value: $125,000 - $184,000
4
Beds
3
Baths
1,251
Sq Ft
$124/Sq Ft
Est. Value
About This Home
This home is located at 2911 N 45th St, Omaha, NE 68104 and is currently estimated at $154,844, approximately $123 per square foot. 2911 N 45th St is a home located in Douglas County with nearby schools including King Elementary School, Monroe Middle School, and Benson Magnet High School.
Ownership History
Date
Name
Owned For
Owner Type
Purchase Details
Closed on
Sep 21, 2007
Sold by
Kelly Mark
Bought by
Torrison Matthew P
Current Estimated Value
Purchase Details
Closed on
Dec 19, 2005
Sold by
Causeway Inc
Bought by
Mark Kelly
Purchase Details
Closed on
Jul 22, 2005
Sold by
Deutsche Bank National Tr
Bought by
Causeway Inc
Purchase Details
Closed on
Apr 20, 2005
Sold by
Lindquist Llo Eric H
Bought by
Deutsche Bank National Trust
Create a Home Valuation Report for This Property
The Home Valuation Report is an in-depth analysis detailing your home's value as well as a comparison with similar homes in the area
Home Values in the Area
Average Home Value in this Area
Purchase History
| Date | Buyer | Sale Price | Title Company |
|---|---|---|---|
| Torrison Matthew P | $62,800 | -- | |
| Mark Kelly | $77,000 | -- | |
| Causeway Inc | $42,500 | -- | |
| Deutsche Bank National Trust | $53,500 | -- |
Source: Public Records
Mortgage History
| Date | Status | Borrower | Loan Amount |
|---|---|---|---|
| Previous Owner | Patterson Daniel A | $61,200 |
Source: Public Records
Tax History Compared to Growth
Tax History
| Year | Tax Paid | Tax Assessment Tax Assessment Total Assessment is a certain percentage of the fair market value that is determined by local assessors to be the total taxable value of land and additions on the property. | Land | Improvement |
|---|---|---|---|---|
| 2023 | $2,091 | $99,100 | $11,300 | $87,800 |
| 2022 | $2,115 | $99,100 | $11,300 | $87,800 |
| 2021 | $1,522 | $71,900 | $11,300 | $60,600 |
| 2020 | $1,539 | $71,900 | $11,300 | $60,600 |
| 2019 | $1,072 | $49,900 | $700 | $49,200 |
| 2018 | $1,049 | $48,800 | $700 | $48,100 |
| 2017 | $821 | $38,000 | $700 | $37,300 |
| 2016 | $612 | $28,500 | $600 | $27,900 |
| 2015 | $1,103 | $52,100 | $6,000 | $46,100 |
| 2014 | $1,103 | $52,100 | $6,000 | $46,100 |
Source: Public Records
Map
Nearby Homes