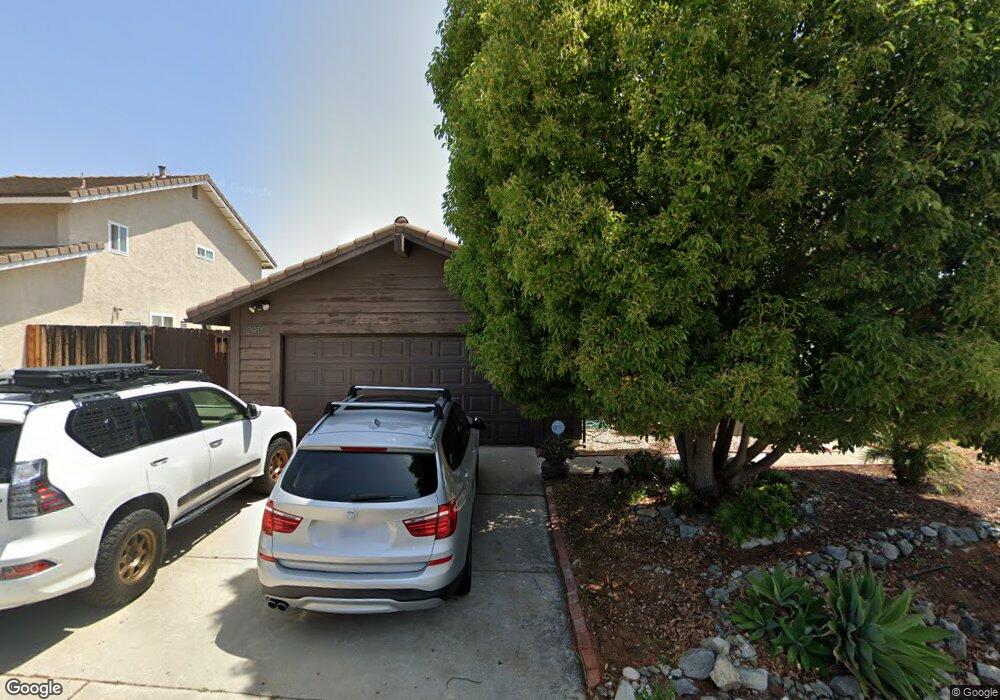
2911 Pine Grove Ct Spring Valley, CA 91978
Estimated Value: $729,000 - $786,000
3
Beds
2
Baths
1,344
Sq Ft
$559/Sq Ft
Est. Value
About This Home
This home is located at 2911 Pine Grove Ct, Spring Valley, CA 91978 and is currently estimated at $751,810, approximately $559 per square foot. 2911 Pine Grove Ct is a home located in San Diego County with nearby schools including Loma Elementary School, Spring Valley Middle School, and Monte Vista High School.
Ownership History
Date
Name
Owned For
Owner Type
Purchase Details
Closed on
Jun 26, 2019
Sold by
Jackson Michelle L
Bought by
Patz Garreti and Patz Leah
Current Estimated Value
Home Financials for this Owner
Home Financials are based on the most recent Mortgage that was taken out on this home.
Original Mortgage
$488,054
Outstanding Balance
$424,718
Interest Rate
3.5%
Mortgage Type
FHA
Estimated Equity
$327,092
Purchase Details
Closed on
Apr 24, 2014
Sold by
Cooper Elizabeth and Hansen Chris
Bought by
Jackson Michelle L
Home Financials for this Owner
Home Financials are based on the most recent Mortgage that was taken out on this home.
Original Mortgage
$352,683
Interest Rate
4.25%
Mortgage Type
FHA
Purchase Details
Closed on
Aug 4, 2004
Sold by
Hebert Agatha D
Bought by
Hebert Agatha D
Create a Home Valuation Report for This Property
The Home Valuation Report is an in-depth analysis detailing your home's value as well as a comparison with similar homes in the area
Home Values in the Area
Average Home Value in this Area
Purchase History
| Date | Buyer | Sale Price | Title Company |
|---|---|---|---|
| Patz Garreti | $524,000 | First American Title Ins Co | |
| Jackson Michelle L | $359,500 | Stewart Title Of Ca Inc | |
| Hebert Agatha D | -- | -- |
Source: Public Records
Mortgage History
| Date | Status | Borrower | Loan Amount |
|---|---|---|---|
| Open | Patz Garreti | $488,054 | |
| Previous Owner | Jackson Michelle L | $352,683 |
Source: Public Records
Tax History
| Year | Tax Paid | Tax Assessment Tax Assessment Total Assessment is a certain percentage of the fair market value that is determined by local assessors to be the total taxable value of land and additions on the property. | Land | Improvement |
|---|---|---|---|---|
| 2025 | $7,426 | $584,527 | $259,296 | $325,231 |
| 2024 | $7,426 | $573,066 | $254,212 | $318,854 |
| 2023 | $7,200 | $561,830 | $249,228 | $312,602 |
| 2022 | $7,094 | $550,815 | $244,342 | $306,473 |
| 2021 | $7,019 | $540,015 | $239,551 | $300,464 |
| 2020 | $6,750 | $534,479 | $237,095 | $297,384 |
| 2019 | $5,160 | $395,055 | $175,247 | $219,808 |
| 2018 | $5,013 | $387,310 | $171,811 | $215,499 |
| 2017 | $4,903 | $379,717 | $168,443 | $211,274 |
| 2016 | $4,727 | $372,273 | $165,141 | $207,132 |
| 2015 | $4,690 | $366,682 | $162,661 | $204,021 |
| 2014 | $2,101 | $142,894 | $63,388 | $79,506 |
Source: Public Records
Map
Nearby Homes
- 10527 Moorpark St
- 3065 Charwood Ct
- 3067 Charwood Ct
- 3037 Chipwood Ct
- 2910 Elm Tree Ct
- 10770 Jamacha Blvd Unit 38
- 10770 Jamacha Blvd Unit 104
- 10770 Jamacha Blvd Unit 74
- 2930 Anawood Way
- 2962 Alanwood Ct
- 10702 Ensworth Way
- 10620 Garden Way
- 3331 Eton Greens Ct
- 10707 Jamacha Blvd Unit SPC 233
- 10707 Jamacha Blvd Unit 72
- 10707 Jamacha Blvd Unit 161
- 10707 Jamacha Blvd Unit 241
- 10128 Hercules Way
- 10767 Jamacha Blvd Unit 98
- 10767 Jamacha Blvd Unit SPC 119
- 2923 Pine Grove Ct
- 10518 Pine Grove St
- 10509 Pine Grove St
- 2912 Pine Grove Ct
- 10503 Pine Grove St
- 10515 Pine Grove St
- 2924 Pine Grove Ct
- 10491 Pine Grove St
- 10519 Pine Grove St
- 10526 Pine Grove St
- 10485 Pine Grove St
- 10523 Pine Grove St
- 3002 Villa Adolee
- 10530 Pine Grove St
- 10527 Pine Grove St
- 3003 Villa Adolee
- 10524 Moorpark St
- 10528 Moorpark St
- 3006 Villa Adolee
- 10471 Pine Grove St
Your Personal Tour Guide
Ask me questions while you tour the home.