
Seller's Agent in 2016
Brian Schantz
TeamWorks Real Estate, LLC
(703) 850-7868
4 Total Sales
Estimated Value: $420,840 - $440,000
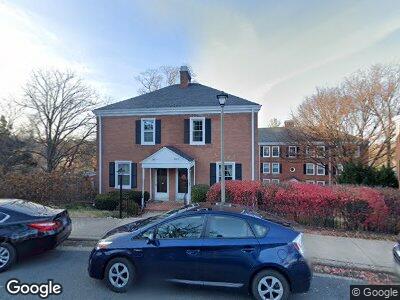
New Kitchen! All new beautiful 42" maple cabinets & hardware, new granite countertops, new stainless steel appliances, new hardwood floors in kitchen, living room, dining room and hallway. Updated bath! Freshly painted. New light fixtures. New mirrored door closets in master bedroom. All utilities and fees included in rent. Large balcony overlooks green area. Incredibly convenient location
| Date | Buyer | Sale Price | Title Company |
|---|---|---|---|
| Chapman Martha A | $282,500 | Rgs Title |
| Date | Status | Borrower | Loan Amount |
|---|---|---|---|
| Open | Chapman Martha A | $211,875 |
| Date | Event | Price | Change | Sq Ft Price |
|---|---|---|---|---|
| 12/15/2016 12/15/16 | Rented | $1,895 | 0.0% | -- |
| 12/06/2016 12/06/16 | Under Contract | -- | -- | -- |
| 11/10/2016 11/10/16 | For Rent | $1,895 | 0.0% | -- |
| 08/31/2016 08/31/16 | Sold | $282,500 | -5.7% | $274 / Sq Ft |
| 08/04/2016 08/04/16 | Pending | -- | -- | -- |
| 07/27/2016 07/27/16 | Price Changed | $299,500 | -2.4% | $290 / Sq Ft |
| 03/11/2016 03/11/16 | For Sale | $307,000 | +8.7% | $298 / Sq Ft |
| 03/06/2016 03/06/16 | Off Market | $282,500 | -- | -- |
| 10/07/2015 10/07/15 | Price Changed | $307,000 | -4.3% | $298 / Sq Ft |
| 05/26/2015 05/26/15 | Price Changed | $320,900 | -1.9% | $311 / Sq Ft |
| 04/03/2015 04/03/15 | For Sale | $327,000 | 0.0% | $317 / Sq Ft |
| 05/15/2013 05/15/13 | Rented | $1,650 | 0.0% | -- |
| 05/06/2013 05/06/13 | Under Contract | -- | -- | -- |
| 04/14/2013 04/14/13 | For Rent | $1,650 | -- | -- |
| Year | Tax Paid | Tax Assessment Tax Assessment Total Assessment is a certain percentage of the fair market value that is determined by local assessors to be the total taxable value of land and additions on the property. | Land | Improvement |
|---|---|---|---|---|
| 2024 | $4,640 | $401,033 | $122,620 | $278,413 |
| 2023 | $4,391 | $395,574 | $122,620 | $272,954 |
| 2022 | $4,305 | $387,818 | $120,216 | $267,602 |
| 2021 | $4,783 | $430,909 | $133,573 | $297,336 |
| 2020 | $4,189 | $381,335 | $118,206 | $263,129 |
| 2019 | $3,990 | $353,088 | $109,450 | $243,638 |
| 2018 | $3,836 | $339,441 | $105,241 | $234,200 |
| 2017 | $3,715 | $328,756 | $101,928 | $226,828 |
| 2016 | $3,528 | $328,756 | $101,928 | $226,828 |
| 2015 | $3,429 | $328,756 | $101,928 | $226,828 |
| 2014 | $3,429 | $328,756 | $101,928 | $226,828 |
Seller's Agent in 2016
Brian Schantz
TeamWorks Real Estate, LLC
(703) 850-7868
4 Total Sales
Seller's Agent in 2016
Barbara Kirkland
Long & Foster
(703) 405-5920
4 Total Sales
Buyer's Agent in 2016
Gina Tufano
Real Broker, LLC
(703) 574-3478
105 Total Sales
B
Seller Co-Listing Agent in 2013
Barbara Wood
Long & Foster
B
Buyer's Agent in 2013
Bud Wood
Long & Foster