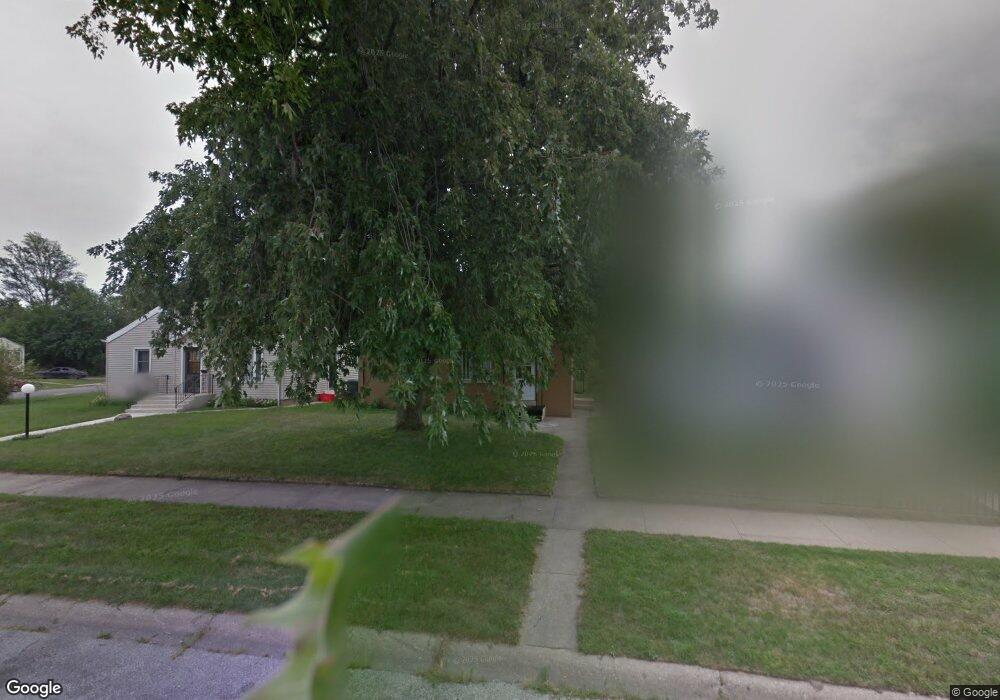
2911 W 12th Ave Gary, IN 46404
Tolleston NeighborhoodEstimated Value: $70,000 - $139,680
4
Beds
2
Baths
1,150
Sq Ft
$89/Sq Ft
Est. Value
About This Home
This home is located at 2911 W 12th Ave, Gary, IN 46404 and is currently estimated at $102,227, approximately $88 per square foot. 2911 W 12th Ave is a home located in Lake County with nearby schools including Beveridge Elementary School, Bailly Preparatory Academy, and West Side Leadership Academy.
Ownership History
Date
Name
Owned For
Owner Type
Purchase Details
Closed on
Oct 25, 2011
Sold by
Stonecrest Income & Opportunity Fund I L
Bought by
Us Home Ownership Llc
Current Estimated Value
Purchase Details
Closed on
Aug 5, 2011
Sold by
Blue Spruce Entities Llc
Bought by
Stonecrest Income & Opportunity Fund I L
Purchase Details
Closed on
Aug 4, 2011
Sold by
Lpp Mortgage Ltd
Bought by
Blue Spruce Entities Llc
Purchase Details
Closed on
Mar 4, 2011
Sold by
Paynes Tracey L
Bought by
Lpp Mortgage Ltd
Purchase Details
Closed on
May 21, 2008
Sold by
Young Clifford Ray
Bought by
Paynes Tracey L
Home Financials for this Owner
Home Financials are based on the most recent Mortgage that was taken out on this home.
Original Mortgage
$72,000
Interest Rate
6.05%
Mortgage Type
Purchase Money Mortgage
Purchase Details
Closed on
Jun 9, 2006
Sold by
Hammond Marcus
Bought by
Young Clifford Ray
Create a Home Valuation Report for This Property
The Home Valuation Report is an in-depth analysis detailing your home's value as well as a comparison with similar homes in the area
Home Values in the Area
Average Home Value in this Area
Purchase History
| Date | Buyer | Sale Price | Title Company |
|---|---|---|---|
| Us Home Ownership Llc | -- | None Available | |
| Stonecrest Income & Opportunity Fund I L | $4,500 | None Available | |
| Blue Spruce Entities Llc | $2,000 | None Available | |
| Lpp Mortgage Ltd | $10,500 | None Available | |
| Paynes Tracey L | -- | Metropolitan Title In Llc | |
| Young Clifford Ray | -- | Stewart Title Services Of No |
Source: Public Records
Mortgage History
| Date | Status | Borrower | Loan Amount |
|---|---|---|---|
| Previous Owner | Paynes Tracey L | $72,000 |
Source: Public Records
Tax History Compared to Growth
Tax History
| Year | Tax Paid | Tax Assessment Tax Assessment Total Assessment is a certain percentage of the fair market value that is determined by local assessors to be the total taxable value of land and additions on the property. | Land | Improvement |
|---|---|---|---|---|
| 2024 | $3,633 | $40,400 | $4,600 | $35,800 |
| 2023 | $1,114 | $41,200 | $4,600 | $36,600 |
| 2022 | $1,114 | $43,500 | $5,500 | $38,000 |
| 2021 | $1,038 | $40,500 | $5,500 | $35,000 |
| 2020 | $1,038 | $40,500 | $5,500 | $35,000 |
| 2019 | $870 | $40,500 | $5,500 | $35,000 |
| 2018 | $919 | $40,500 | $5,500 | $35,000 |
| 2017 | $702 | $29,700 | $5,500 | $24,200 |
| 2016 | $795 | $34,500 | $5,500 | $29,000 |
| 2014 | $805 | $34,400 | $5,500 | $28,900 |
| 2013 | $782 | $34,800 | $5,500 | $29,300 |
Source: Public Records
Map
Nearby Homes
- 1139 Taney St
- 1330 Taney Place
- 1336 Marshall Place
- 3028 W 15th Ave
- 4300 W 15th Ave
- 1582 Taney Place
- 1355 Ellsworth St
- 1166 Noble St
- 785 Taney St
- 1570 Hendricks St
- 2357 W 9th Ave
- 1755 Ellsworth St
- 2243 W 10th Place
- 2568 W 19th Place
- 1120 Wallace St
- 1025 Wallace St
- 1379 Roosevelt Place
- 2412 W 19th Ave
- 2257 W 16th Ave
- 2967 W 20th Ave
- 2947 W 12th Ave Unit 51
- 2919 W 12th Ave
- 2905 W 12th Ave
- 2927 W 12th Ave
- 2933 W 12th Ave
- 2939 W 12th Ave
- 2912 W 12th Ave
- 2922 W 12th Ave
- 2912 W 13th Ave
- 2918 W 13th Ave
- 2900 W 12th Ave
- 2906 W 13th Ave
- 2900 W 13th Ave
- 2934 W 13th Ave
- 2924 W 13th Ave
- 2936 W 12th Ave
- 2936 W 13th Ave
- 2795 W 12th Ave
- 1209 Taney St
- 2953 W 12th Ave