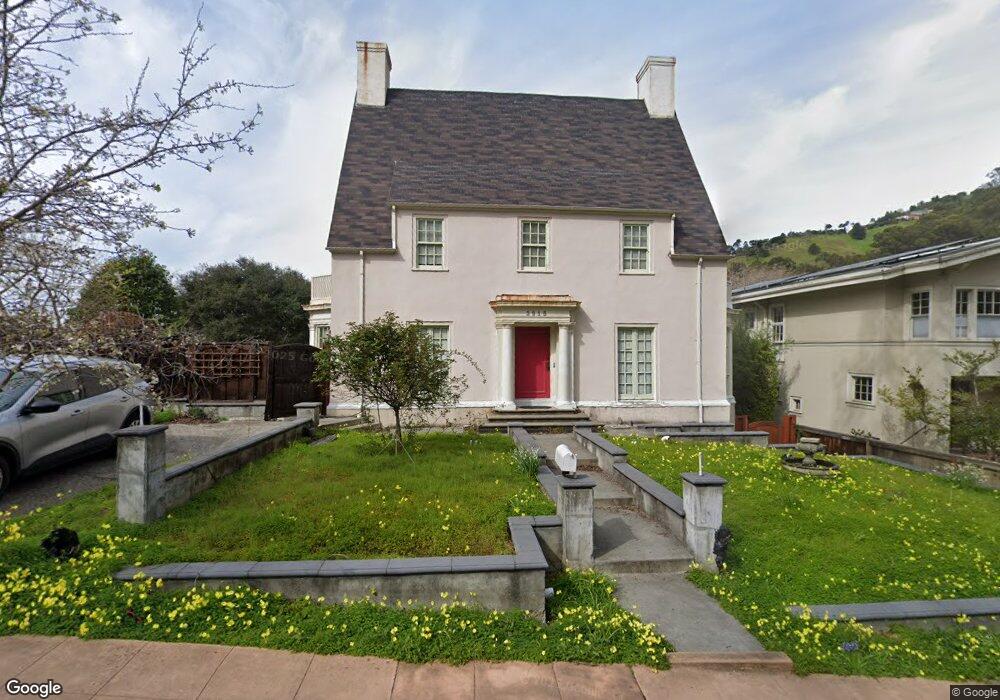
2915 Garber St Berkeley, CA 94705
Claremont NeighborhoodEstimated Value: $1,944,000 - $3,503,000
3
Beds
4
Baths
2,406
Sq Ft
$1,071/Sq Ft
Est. Value
About This Home
This home is located at 2915 Garber St, Berkeley, CA 94705 and is currently estimated at $2,577,597, approximately $1,071 per square foot. 2915 Garber St is a home located in Alameda County with nearby schools including John Muir Elementary School, Emerson Elementary School, and Malcolm X Elementary School.
Ownership History
Date
Name
Owned For
Owner Type
Purchase Details
Closed on
Oct 10, 2008
Sold by
Rai Jaswant S
Bought by
Grewal Amninder K
Current Estimated Value
Purchase Details
Closed on
Mar 22, 2005
Sold by
Rai Aminder K
Bought by
Rai Jaswant S
Purchase Details
Closed on
Apr 6, 2001
Sold by
Ferris Yehuda Y and Ferris Miriam C
Bought by
Rai Jaswant S and Rai Aminder K
Home Financials for this Owner
Home Financials are based on the most recent Mortgage that was taken out on this home.
Original Mortgage
$650,000
Interest Rate
6.5%
Purchase Details
Closed on
Aug 15, 2000
Sold by
Gaddis William P
Bought by
Ferris Yehuda Y and Ferris Miriam C
Home Financials for this Owner
Home Financials are based on the most recent Mortgage that was taken out on this home.
Original Mortgage
$770,000
Interest Rate
8.75%
Create a Home Valuation Report for This Property
The Home Valuation Report is an in-depth analysis detailing your home's value as well as a comparison with similar homes in the area
Home Values in the Area
Average Home Value in this Area
Purchase History
| Date | Buyer | Sale Price | Title Company |
|---|---|---|---|
| Grewal Amninder K | $765,000 | None Available | |
| Rai Jaswant S | -- | -- | |
| Rai Jaswant S | $1,275,000 | Old Republic Title Company | |
| Ferris Yehuda Y | $1,100,000 | Placer Title Company |
Source: Public Records
Mortgage History
| Date | Status | Borrower | Loan Amount |
|---|---|---|---|
| Previous Owner | Rai Jaswant S | $650,000 | |
| Previous Owner | Ferris Yehuda Y | $770,000 |
Source: Public Records
Tax History
| Year | Tax Paid | Tax Assessment Tax Assessment Total Assessment is a certain percentage of the fair market value that is determined by local assessors to be the total taxable value of land and additions on the property. | Land | Improvement |
|---|---|---|---|---|
| 2025 | $15,415 | $829,985 | $450,684 | $386,301 |
| 2024 | $15,415 | $813,579 | $441,850 | $378,729 |
| 2023 | $15,065 | $804,492 | $433,188 | $371,304 |
| 2022 | $14,726 | $781,723 | $424,697 | $364,026 |
| 2021 | $14,720 | $766,259 | $416,370 | $356,889 |
| 2020 | $13,743 | $765,336 | $412,104 | $353,232 |
| 2019 | $13,005 | $750,334 | $404,026 | $346,308 |
| 2018 | $12,745 | $735,624 | $396,105 | $339,519 |
| 2017 | $12,294 | $721,201 | $388,339 | $332,862 |
| 2016 | $11,774 | $707,063 | $380,726 | $326,337 |
| 2015 | $11,596 | $696,449 | $375,011 | $321,438 |
| 2014 | $11,415 | $682,812 | $367,668 | $315,144 |
Source: Public Records
Map
Nearby Homes
- 2817 Palm Ct
- 2632 Warring St Unit 3
- 190 Stonewall Rd
- 2643 Stuart St
- 2962 Piedmont Ave
- 2601 College Ave Unit 203
- 2601 College Ave Unit 208
- 641 Alvarado Rd
- 2 Gravatt Dr
- 0 Gravatt Dr Unit 41122154
- 161 Panoramic Way
- 1488 Alvarado Rd
- 3382 Dwight Way
- 2 Panoramic Way Unit 105
- 2 Panoramic Way Unit 304
- 2935 Florence St
- 2477 Prince St
- 0 Panoramic Way Unit 41118724
- 142 Gravatt Dr
- 204 El Camino Real
- 2917 Garber St
- 2905 Garber St
- 2914 Forest Ave
- 2910 Forest Ave
- 2918 Forest Ave
- 2925 Garber St
- 2901 Garber St
- 2906 Forest Ave
- 2849 Garber St
- 2910 Garber St
- 2916 Garber St
- 2922 Forest Ave
- 2904 Garber St
- 2900 Forest Ave
- 2922 Garber St
- 2926 Forest Ave
- 2900 Garber St
- 2927 Garber St
- 2844 Forest Ave
- 2930 Garber St
Your Personal Tour Guide
Ask me questions while you tour the home.