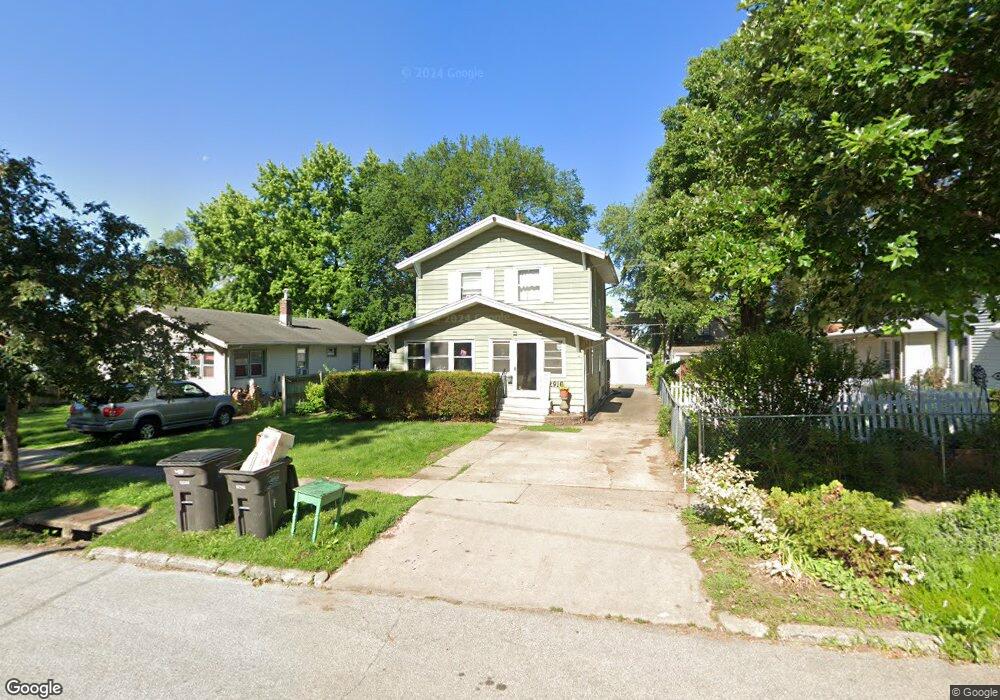
2916 5th Ave Des Moines, IA 50313
Highland Park NeighborhoodEstimated Value: $161,000 - $180,000
3
Beds
1
Bath
1,248
Sq Ft
$135/Sq Ft
Est. Value
About This Home
This home is located at 2916 5th Ave, Des Moines, IA 50313 and is currently estimated at $169,096, approximately $135 per square foot. 2916 5th Ave is a home located in Polk County with nearby schools including Oak Park Elementary School, Harding Middle School, and North High School.
Ownership History
Date
Name
Owned For
Owner Type
Purchase Details
Closed on
Nov 4, 2025
Sold by
Kimberly Cannon Cannon Family Trust
Bought by
Andrew T Reed Family Trust
Current Estimated Value
Purchase Details
Closed on
Aug 13, 2024
Sold by
Cannon Kimberly A
Bought by
Cannon Kimberly A and Reed Andrew T
Purchase Details
Closed on
Dec 13, 2023
Sold by
Cannon Patricia A
Bought by
Cannon Kimberly A
Create a Home Valuation Report for This Property
The Home Valuation Report is an in-depth analysis detailing your home's value as well as a comparison with similar homes in the area
Home Values in the Area
Average Home Value in this Area
Purchase History
| Date | Buyer | Sale Price | Title Company |
|---|---|---|---|
| Andrew T Reed Family Trust | -- | None Listed On Document | |
| Cannon Kimberly A | -- | None Listed On Document | |
| Cannon Kimberly A | -- | None Listed On Document | |
| Cannon Kimberly A | -- | None Listed On Document |
Source: Public Records
Tax History Compared to Growth
Tax History
| Year | Tax Paid | Tax Assessment Tax Assessment Total Assessment is a certain percentage of the fair market value that is determined by local assessors to be the total taxable value of land and additions on the property. | Land | Improvement |
|---|---|---|---|---|
| 2025 | $2,200 | $159,800 | $18,400 | $141,400 |
| 2024 | $2,200 | $137,900 | $15,800 | $122,100 |
| 2023 | $2,428 | $137,900 | $15,800 | $122,100 |
| 2022 | $2,408 | $115,300 | $13,700 | $101,600 |
| 2021 | $2,204 | $115,300 | $13,700 | $101,600 |
| 2020 | $2,282 | $100,200 | $12,000 | $88,200 |
| 2019 | $2,052 | $100,200 | $12,000 | $88,200 |
| 2018 | $2,024 | $88,100 | $10,400 | $77,700 |
| 2017 | $2,030 | $88,100 | $10,400 | $77,700 |
| 2016 | $1,970 | $86,800 | $10,200 | $76,600 |
| 2015 | $1,970 | $86,800 | $10,200 | $76,600 |
| 2014 | $2,000 | $90,400 | $10,500 | $79,900 |
Source: Public Records
Map
Nearby Homes