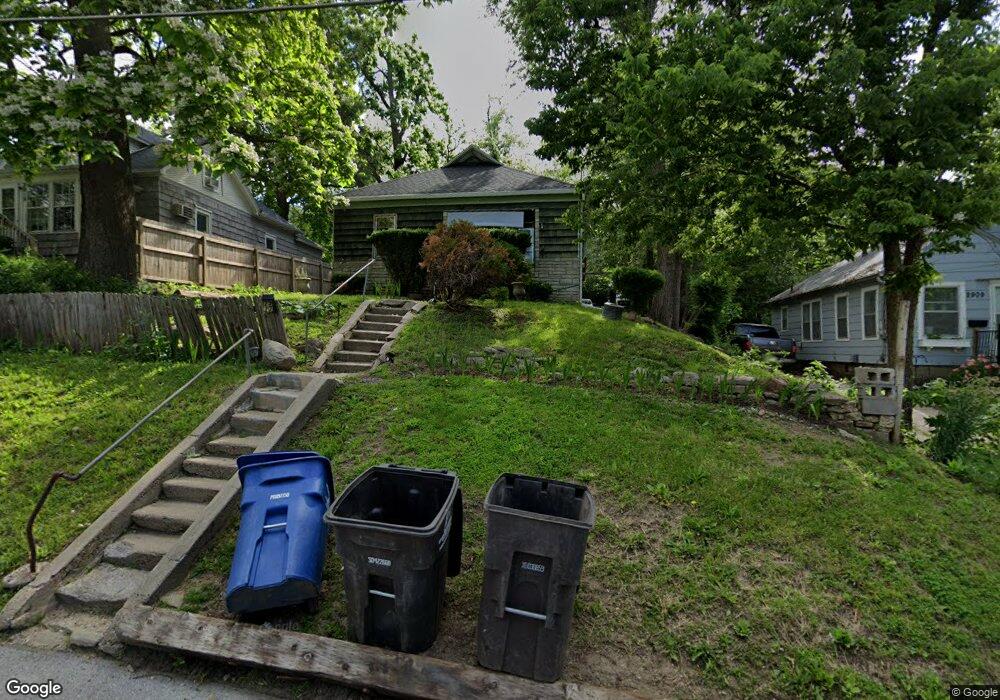
2917 1st St Des Moines, IA 50313
Union Park NeighborhoodEstimated Value: $118,000 - $154,000
3
Beds
1
Bath
848
Sq Ft
$157/Sq Ft
Est. Value
About This Home
This home is located at 2917 1st St, Des Moines, IA 50313 and is currently estimated at $133,235, approximately $157 per square foot. 2917 1st St is a home located in Polk County with nearby schools including Findley Elementary School, Harding Middle School, and North High School.
Ownership History
Date
Name
Owned For
Owner Type
Purchase Details
Closed on
Apr 24, 2006
Sold by
Butz Margie J
Bought by
Caceres Rafael E and Herrera Greis
Current Estimated Value
Home Financials for this Owner
Home Financials are based on the most recent Mortgage that was taken out on this home.
Original Mortgage
$50,350
Outstanding Balance
$29,035
Interest Rate
6.42%
Mortgage Type
Fannie Mae Freddie Mac
Estimated Equity
$104,200
Purchase Details
Closed on
Mar 7, 2000
Sold by
Butz Marion and Butz Magie
Bought by
Lubbock Rosemary
Home Financials for this Owner
Home Financials are based on the most recent Mortgage that was taken out on this home.
Original Mortgage
$64,900
Interest Rate
10%
Mortgage Type
Seller Take Back
Purchase Details
Closed on
Nov 26, 1999
Sold by
Mcewen Walter D and Mcewen Laura I
Bought by
Walter D & Laura I Mcewen Living Trust
Create a Home Valuation Report for This Property
The Home Valuation Report is an in-depth analysis detailing your home's value as well as a comparison with similar homes in the area
Home Values in the Area
Average Home Value in this Area
Purchase History
| Date | Buyer | Sale Price | Title Company |
|---|---|---|---|
| Caceres Rafael E | $52,500 | None Available | |
| Butz Margie J | $31,000 | None Available | |
| Lubbock Rosemary | $69,900 | -- | |
| Walter D & Laura I Mcewen Living Trust | -- | -- |
Source: Public Records
Mortgage History
| Date | Status | Borrower | Loan Amount |
|---|---|---|---|
| Open | Caceres Rafael E | $50,350 | |
| Previous Owner | Lubbock Rosemary | $64,900 |
Source: Public Records
Tax History Compared to Growth
Tax History
| Year | Tax Paid | Tax Assessment Tax Assessment Total Assessment is a certain percentage of the fair market value that is determined by local assessors to be the total taxable value of land and additions on the property. | Land | Improvement |
|---|---|---|---|---|
| 2025 | $1,988 | $116,000 | $21,200 | $94,800 |
| 2024 | $1,988 | $101,100 | $18,200 | $82,900 |
| 2023 | $2,000 | $101,100 | $18,200 | $82,900 |
| 2022 | $1,986 | $84,900 | $15,900 | $69,000 |
| 2021 | $1,864 | $84,900 | $15,900 | $69,000 |
| 2020 | $1,936 | $74,700 | $13,900 | $60,800 |
| 2019 | $1,674 | $74,700 | $13,900 | $60,800 |
| 2018 | $1,658 | $62,300 | $12,000 | $50,300 |
| 2017 | $1,680 | $62,300 | $12,000 | $50,300 |
| 2016 | $1,636 | $62,100 | $11,800 | $50,300 |
| 2015 | $1,636 | $62,100 | $11,800 | $50,300 |
| 2014 | $1,802 | $70,400 | $13,000 | $57,400 |
Source: Public Records
Map
Nearby Homes