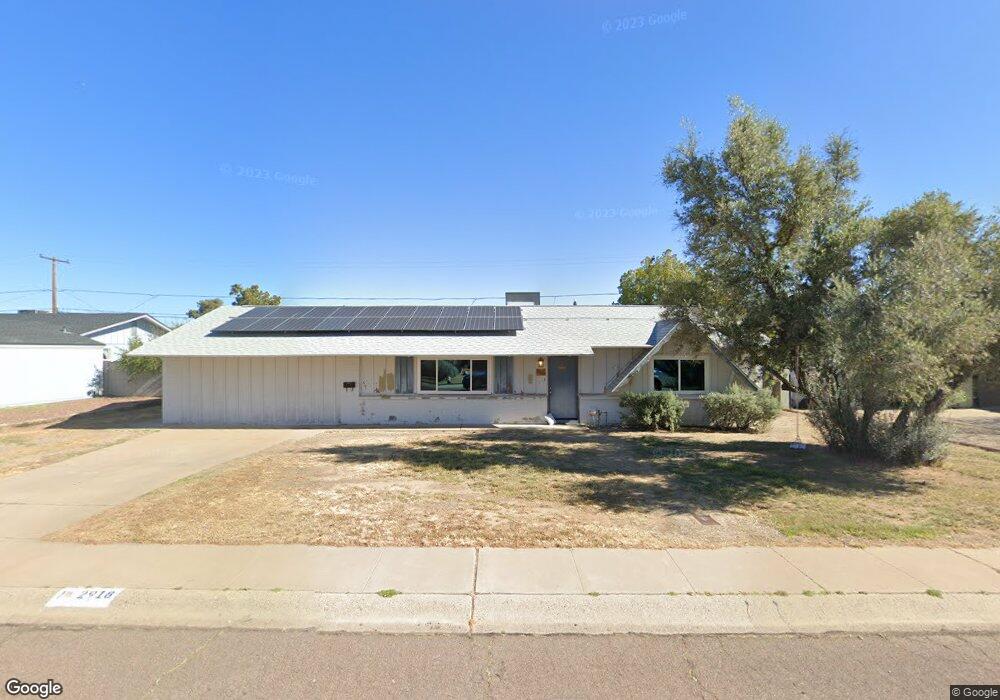
2918 E Shangri la Rd Phoenix, AZ 85028
Paradise Valley Village NeighborhoodEstimated Value: $417,599 - $747,000
--
Bed
2
Baths
1,860
Sq Ft
$323/Sq Ft
Est. Value
About This Home
This home is located at 2918 E Shangri la Rd, Phoenix, AZ 85028 and is currently estimated at $600,900, approximately $323 per square foot. 2918 E Shangri la Rd is a home located in Maricopa County with nearby schools including Desert Cove Elementary School, Shea Middle School, and Shadow Mountain High School.
Ownership History
Date
Name
Owned For
Owner Type
Purchase Details
Closed on
Feb 2, 2022
Sold by
Cordova Heather M
Bought by
Thomas Richard William
Current Estimated Value
Purchase Details
Closed on
Nov 23, 2020
Sold by
Hall John H Jr Trust
Bought by
Hall John H
Purchase Details
Closed on
Jan 16, 2007
Sold by
Hall John H
Bought by
Hall John H and The John H Hall Jr Living Trust
Create a Home Valuation Report for This Property
The Home Valuation Report is an in-depth analysis detailing your home's value as well as a comparison with similar homes in the area
Home Values in the Area
Average Home Value in this Area
Purchase History
| Date | Buyer | Sale Price | Title Company |
|---|---|---|---|
| Thomas Richard William | -- | None Listed On Document | |
| Hall John H | -- | Hall Matt | |
| Hall John H | -- | None Available |
Source: Public Records
Tax History Compared to Growth
Tax History
| Year | Tax Paid | Tax Assessment Tax Assessment Total Assessment is a certain percentage of the fair market value that is determined by local assessors to be the total taxable value of land and additions on the property. | Land | Improvement |
|---|---|---|---|---|
| 2025 | $1,753 | $20,244 | -- | -- |
| 2024 | $1,669 | $19,280 | -- | -- |
| 2023 | $1,669 | $38,330 | $7,660 | $30,670 |
| 2022 | $1,653 | $30,220 | $6,040 | $24,180 |
| 2021 | $1,681 | $27,680 | $5,530 | $22,150 |
| 2020 | $1,623 | $26,010 | $5,200 | $20,810 |
| 2019 | $1,630 | $23,480 | $4,690 | $18,790 |
| 2018 | $1,571 | $21,070 | $4,210 | $16,860 |
| 2017 | $1,501 | $20,080 | $4,010 | $16,070 |
| 2016 | $1,477 | $19,430 | $3,880 | $15,550 |
| 2015 | $1,370 | $17,630 | $3,520 | $14,110 |
Source: Public Records
Map
Nearby Homes
- 3010 E Yucca St
- 3052 E Lupine Ave
- 11222 N 32nd St
- 2715 E Sierra St
- 11806 N 30th St Unit 2
- 11007 N 26th St
- 11001 N 26th St
- 10625 N 26th St
- 3352 E Mescal St
- 2501 E Cholla St
- 2440 E Yucca St
- 11303 N 34th St
- 3039 E Cactus Rd
- 11449 N Bancroft Dr
- 2802 E Cheryl Dr
- 2914 E Cactus Rd
- 3128 E Cheryl Dr
- 11442 N Bancroft Dr
- 10624 N 25th St
- 3422 E Sunnyside Dr
- 2910 E Shangri la Rd
- 2926 E Shangri la Rd
- 2921 E Yucca St
- 2921 E Shangri la Rd
- 2915 E Shangri la Rd
- 2934 E Shangri la Rd
- 2902 E Shangri la Rd
- 2915 E Yucca St
- 2933 E Yucca St
- 2927 E Shangri la Rd
- 2909 E Shangri la Rd
- 2909 E Yucca St
- 2848 E Shangri la Rd
- 2940 E Shangri la Rd
- 2940 E Shangri la Rd Unit 2627
- 2933 E Shangri la Rd
- 2901 E Shangri la Rd
- 2941 E Yucca St
- 2926 E Yucca St
- 2910 E Desert Cove Ave