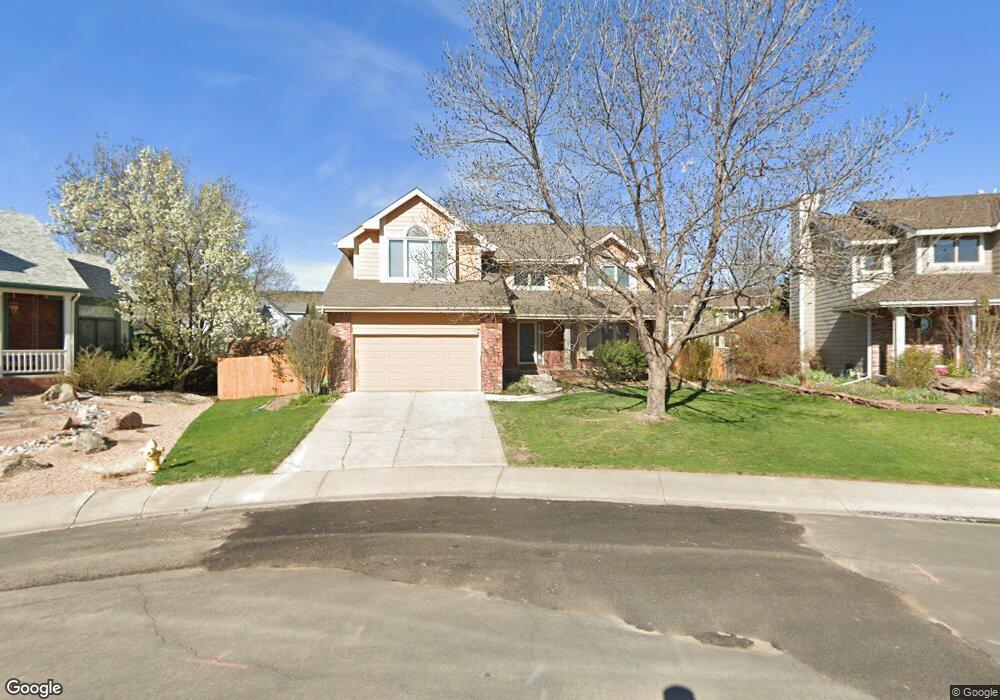
2919 Teal Eye Ct Fort Collins, CO 80526
Estimated Value: $765,771 - $862,000
5
Beds
4
Baths
2,361
Sq Ft
$345/Sq Ft
Est. Value
About This Home
This home is located at 2919 Teal Eye Ct, Fort Collins, CO 80526 and is currently estimated at $813,443, approximately $344 per square foot. 2919 Teal Eye Ct is a home located in Larimer County with nearby schools including Olander Elementary School, Blevins Middle School, and Rocky Mountain High School.
Ownership History
Date
Name
Owned For
Owner Type
Purchase Details
Closed on
Mar 30, 2022
Sold by
Stoner Thomas L and Stoner Renee S
Bought by
Stoner Thomas L and Stoner Renee S
Current Estimated Value
Purchase Details
Closed on
Aug 15, 2006
Sold by
Brady Robyn M
Bought by
Stoner Thomas L and Stoner Renee S
Home Financials for this Owner
Home Financials are based on the most recent Mortgage that was taken out on this home.
Original Mortgage
$272,000
Interest Rate
6.77%
Mortgage Type
New Conventional
Purchase Details
Closed on
Mar 13, 2000
Sold by
Brady Patrick M
Bought by
Brady Robyn M
Purchase Details
Closed on
Jul 1, 1993
Sold by
Kem Homes Inc
Bought by
Brady Robyn M
Purchase Details
Closed on
Apr 1, 1993
Sold by
Jensen D Enterprises Inc
Bought by
Kem Homes Inc
Create a Home Valuation Report for This Property
The Home Valuation Report is an in-depth analysis detailing your home's value as well as a comparison with similar homes in the area
Home Values in the Area
Average Home Value in this Area
Purchase History
| Date | Buyer | Sale Price | Title Company |
|---|---|---|---|
| Stoner Thomas L | -- | None Listed On Document | |
| Stoner Thomas L | $340,000 | Stewart Title Of Colorado | |
| Brady Robyn M | -- | -- | |
| Brady Robyn M | $168,900 | -- | |
| Kem Homes Inc | $27,800 | -- |
Source: Public Records
Mortgage History
| Date | Status | Borrower | Loan Amount |
|---|---|---|---|
| Previous Owner | Stoner Thomas L | $272,000 |
Source: Public Records
Tax History Compared to Growth
Tax History
| Year | Tax Paid | Tax Assessment Tax Assessment Total Assessment is a certain percentage of the fair market value that is determined by local assessors to be the total taxable value of land and additions on the property. | Land | Improvement |
|---|---|---|---|---|
| 2025 | $3,942 | $51,469 | $4,020 | $47,449 |
| 2024 | $3,751 | $51,469 | $4,020 | $47,449 |
| 2022 | $2,822 | $36,835 | $4,170 | $32,665 |
| 2021 | $2,852 | $37,895 | $4,290 | $33,605 |
| 2020 | $2,758 | $36,629 | $4,290 | $32,339 |
| 2019 | $2,770 | $36,629 | $4,290 | $32,339 |
| 2018 | $3,310 | $36,317 | $4,320 | $31,997 |
| 2017 | $3,299 | $36,317 | $4,320 | $31,997 |
| 2016 | $2,917 | $31,951 | $4,776 | $27,175 |
| 2015 | $2,896 | $31,960 | $4,780 | $27,180 |
| 2014 | $2,587 | $28,360 | $4,780 | $23,580 |
Source: Public Records
Map
Nearby Homes
- 2843 Seccomb St
- 3207 Nesbit Ct
- 2455 Wyandotte Dr
- 3525 Auntie Stone St Unit 8
- 2415 Dalton Dr
- 2114 Water Blossom Ln
- 2 County Road 19
- 3009 Knolls End Dr Unit 5
- 2607 S Taft Hill Rd
- 2800 S Taft Hill Rd
- 2025 Cheshire St
- 3712 Mead St
- 3136 Birmingham Dr
- 2925 W Stuart St Unit 11
- 2930 W Stuart St Unit 24
- 1905 Yorktown Ave
- 2124 Manchester Dr
- 2960 W Stuart St Unit A304
- 3717 S Taft Hill Rd Unit 279
- 3717 S Taft Hill Rd Unit 111
- 2913 Teal Eye Ct
- 2925 Teal Eye Ct
- 2912 Mercy Dr
- 2906 Mercy Dr
- 2718 Beaver Ct
- 2918 Mercy Dr
- 2907 Teal Eye Ct
- 2900 Mercy Dr
- 2924 Teal Eye Ct
- 2912 Teal Eye Ct
- 2918 Teal Eye Ct
- 2712 Beaver Ct
- 2901 Teal Eye Ct
- 2906 Teal Eye Ct
- 2842 Mercy Dr
- 2913 Mercy Dr
- 2919 Mercy Dr
- 2713 Beaver Ct
- 2900 Teal Eye Ct
- 2831 Teal Eye Ct