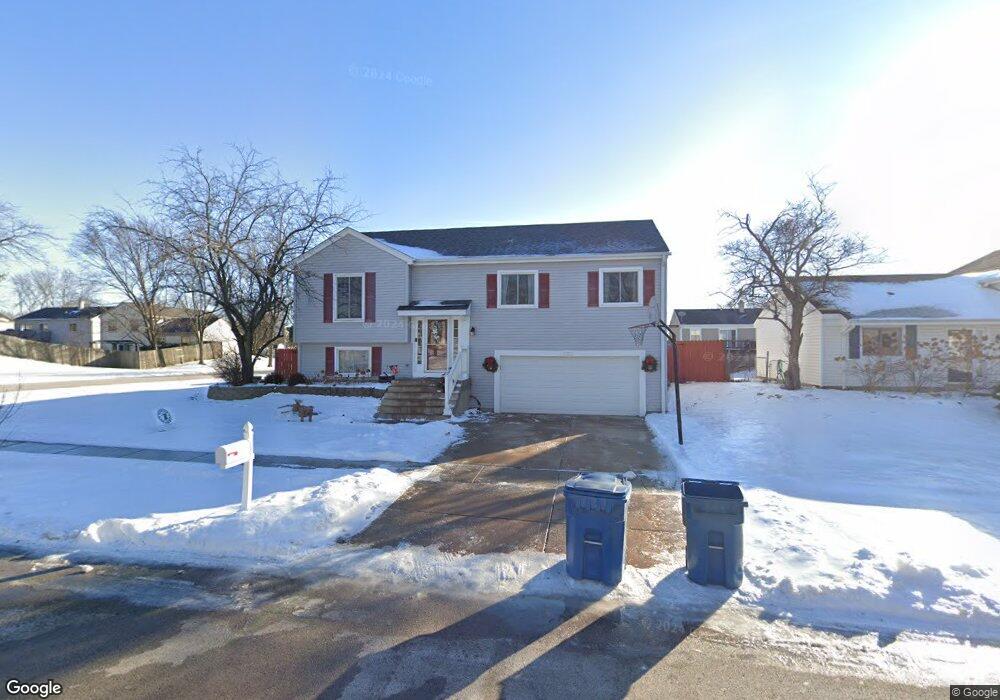
292 Porter Ct Unit 3 Bartlett, IL 60103
South Tri Village NeighborhoodEstimated Value: $357,182 - $413,000
3
Beds
1
Bath
1,802
Sq Ft
$211/Sq Ft
Est. Value
About This Home
This home is located at 292 Porter Ct Unit 3, Bartlett, IL 60103 and is currently estimated at $381,046, approximately $211 per square foot. 292 Porter Ct Unit 3 is a home located in DuPage County with nearby schools including Centennial School, Eastview Middle School, and Bartlett High School.
Ownership History
Date
Name
Owned For
Owner Type
Purchase Details
Closed on
Aug 4, 2022
Sold by
Langmaack Patricia K
Bought by
Patricia Langmaack Living Trust
Current Estimated Value
Purchase Details
Closed on
Sep 24, 2000
Sold by
Langmaack Richard
Bought by
Langmaack Patricia
Purchase Details
Closed on
Jan 20, 1995
Sold by
Gulley Matthew C and Gulley Susanne M
Bought by
Langmaack Richard L and Langmaack Patricia K
Home Financials for this Owner
Home Financials are based on the most recent Mortgage that was taken out on this home.
Original Mortgage
$129,850
Interest Rate
8%
Mortgage Type
FHA
Purchase Details
Closed on
Jun 22, 1994
Sold by
Beach Martin D and Beach Kathleen L
Bought by
Gulley Matthew C and Gulley Susanne M
Home Financials for this Owner
Home Financials are based on the most recent Mortgage that was taken out on this home.
Original Mortgage
$131,953
Interest Rate
8.78%
Mortgage Type
FHA
Create a Home Valuation Report for This Property
The Home Valuation Report is an in-depth analysis detailing your home's value as well as a comparison with similar homes in the area
Home Values in the Area
Average Home Value in this Area
Purchase History
| Date | Buyer | Sale Price | Title Company |
|---|---|---|---|
| Patricia Langmaack Living Trust | -- | New Title Company Name | |
| Langmaack Patricia | -- | -- | |
| Langmaack Richard L | $135,000 | -- | |
| Gulley Matthew C | $201,000 | Plm Title |
Source: Public Records
Mortgage History
| Date | Status | Borrower | Loan Amount |
|---|---|---|---|
| Previous Owner | Langmaack Richard L | $129,850 | |
| Previous Owner | Gulley Matthew C | $131,953 |
Source: Public Records
Tax History
| Year | Tax Paid | Tax Assessment Tax Assessment Total Assessment is a certain percentage of the fair market value that is determined by local assessors to be the total taxable value of land and additions on the property. | Land | Improvement |
|---|---|---|---|---|
| 2024 | $7,937 | $106,164 | $33,595 | $72,569 |
| 2023 | $7,279 | $96,320 | $30,480 | $65,840 |
| 2022 | $7,298 | $89,520 | $28,330 | $61,190 |
| 2021 | $7,084 | $84,980 | $26,890 | $58,090 |
| 2020 | $6,910 | $82,430 | $26,080 | $56,350 |
| 2019 | $6,813 | $79,490 | $25,150 | $54,340 |
| 2018 | $6,419 | $73,130 | $24,070 | $49,060 |
| 2017 | $6,230 | $70,210 | $23,110 | $47,100 |
| 2016 | $6,102 | $67,060 | $22,070 | $44,990 |
| 2015 | $5,760 | $60,450 | $19,890 | $40,560 |
| 2014 | $5,163 | $57,040 | $19,390 | $37,650 |
| 2013 | $6,201 | $58,400 | $19,850 | $38,550 |
Source: Public Records
Map
Nearby Homes
- 244 Ewell Ct Unit 2
- 304 Jackson St
- 829 Prairie Ave
- 340 Windsor Dr
- 361 Sundance Dr
- 396 Nantucket Ct
- 1110 Sausalito Ct
- 482 Nicole Dr Unit 8B
- 1105 Sandpiper Ct
- 747 Cove Ct
- 195 E Oak Glen Dr
- 1053 Hummingbird Way
- 5308 Cinema Dr W
- 370 Wilmington Dr Unit D2
- 303 Newport Ln Unit D2
- 318 S Prospect Ave
- 615 Mallard Ct Unit C2
- 249 Surrey Rd
- 27W607 Devon Ave
- 644 Cedar Ln
- 288 Porter Ct
- 291 Lincoln Dr
- 291 Porter Ct
- 284 Porter Ct
- 287 Porter Ct
- 287 Lincoln Dr
- 300 Mansfield Ct
- 303 Lincoln Dr
- 301 Mansfield Ct
- 283 Porter Ct
- 283 Lincoln Dr
- 280 Porter Ct
- 306 Mansfield Ct
- 307 Lincoln Dr
- 292 Pickett Ct
- 305 Mansfield Ct Unit 3
- 288 Pickett Ct
- 279 Lincoln Dr
- 948 Grant St
- 284 Pickett Ct
Your Personal Tour Guide
Ask me questions while you tour the home.