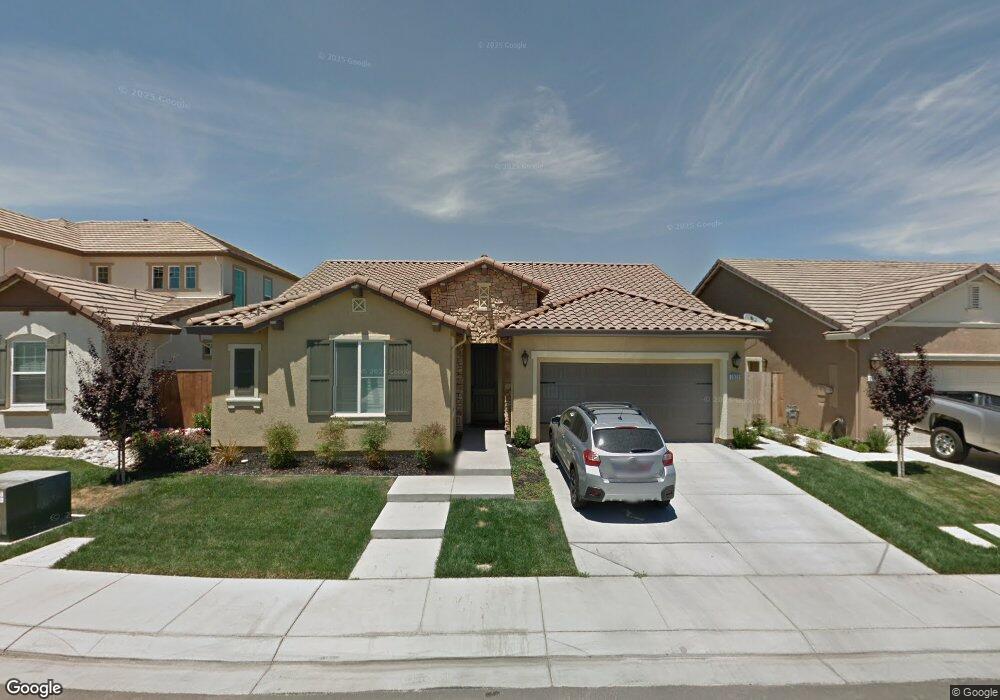
2920 Westport Cir Oakdale, CA 95361
Estimated Value: $530,609 - $633,000
3
Beds
3
Baths
1,854
Sq Ft
$316/Sq Ft
Est. Value
About This Home
This home is located at 2920 Westport Cir, Oakdale, CA 95361 and is currently estimated at $585,652, approximately $315 per square foot. 2920 Westport Cir is a home located in Stanislaus County with nearby schools including Fair Oaks Elementary School, Oakdale Junior High School, and East Stanislaus High School.
Ownership History
Date
Name
Owned For
Owner Type
Purchase Details
Closed on
Jan 24, 2019
Sold by
Braner Richard C and Braner Diane M
Bought by
Braner Richard C and Braner Diane M
Current Estimated Value
Purchase Details
Closed on
Dec 8, 2016
Sold by
Campbell Brett T and Borgesio Campbell Pauleen D
Bought by
Braner Richard C and Braner Diane M
Home Financials for this Owner
Home Financials are based on the most recent Mortgage that was taken out on this home.
Original Mortgage
$276,400
Outstanding Balance
$222,737
Interest Rate
3.54%
Mortgage Type
New Conventional
Estimated Equity
$362,915
Purchase Details
Closed on
May 9, 2014
Sold by
Westport Building Partners Lp
Bought by
Campbell Brett T and Borgesi Campbell Pauleen D
Home Financials for this Owner
Home Financials are based on the most recent Mortgage that was taken out on this home.
Original Mortgage
$240,520
Interest Rate
4.35%
Mortgage Type
New Conventional
Create a Home Valuation Report for This Property
The Home Valuation Report is an in-depth analysis detailing your home's value as well as a comparison with similar homes in the area
Home Values in the Area
Average Home Value in this Area
Purchase History
| Date | Buyer | Sale Price | Title Company |
|---|---|---|---|
| Braner Richard C | -- | None Available | |
| Braner Richard C | -- | None Available | |
| Braner Richard C | $348,000 | Stewart Title Of Ca Inc | |
| Campbell Brett T | $301,000 | First American Title Company |
Source: Public Records
Mortgage History
| Date | Status | Borrower | Loan Amount |
|---|---|---|---|
| Open | Braner Richard C | $276,400 | |
| Previous Owner | Campbell Brett T | $240,520 |
Source: Public Records
Tax History Compared to Growth
Tax History
| Year | Tax Paid | Tax Assessment Tax Assessment Total Assessment is a certain percentage of the fair market value that is determined by local assessors to be the total taxable value of land and additions on the property. | Land | Improvement |
|---|---|---|---|---|
| 2025 | $5,752 | $406,096 | $127,661 | $278,435 |
| 2024 | $5,496 | $398,134 | $125,158 | $272,976 |
| 2023 | $5,384 | $390,328 | $122,704 | $267,624 |
| 2022 | $5,273 | $382,676 | $120,299 | $262,377 |
| 2021 | $5,174 | $375,174 | $117,941 | $257,233 |
| 2020 | $5,117 | $371,328 | $116,732 | $254,596 |
| 2019 | $5,026 | $364,048 | $114,444 | $249,604 |
| 2018 | $4,885 | $352,410 | $112,200 | $240,210 |
| 2017 | $4,878 | $345,500 | $110,000 | $235,500 |
| 2016 | $4,424 | $311,694 | $103,553 | $208,141 |
| 2015 | $4,370 | $307,013 | $101,998 | $205,015 |
| 2014 | $1,252 | $18,130 | $18,130 | $0 |
Source: Public Records
Map
Nearby Homes
- 2908 Westport Cir
- 2532 Laurel Ridge Ct
- 311 Carriage Ln
- The Skyline Plan at Saddlewood
- The Pinnacle Plan at Saddlewood
- The Vantage Plan at Saddlewood
- 2637 Morgan St
- 2376 Shire Way
- 2319 Tori Way
- 563 Bascule Dr
- 602 Criolla Dr
- 2272 Tori Way
- 549 Fresian Dr
- 2306 W F St
- 8400 Crane Rd
- 2201 Mustang Dr
- 2337 Rainwood Ln
- 2030 Baluchi Way
- 15 Willowood Dr
- 1972 Sugar Pine Dr
- 2924 Westport Cir
- 2916 Westport Cir
- 2928 Westport Cir
- 2912 Westport Cir
- 2905 Westport Cir
- 2921 Westport Cir
- 2925 Westport Cir
- 2932 Westport Cir
- 2929 Westport Cir
- 2904 Westport Cir
- 2901 Westport Cir
- 2879 Westport Cir
- 2933 Westport Cir
- 2900 Westport Cir
- 2875 Westport Cir
- 2871 Westport Cir
- 2937 Westport Cir
- 2867 Westport Cir
- 2800 Westport Cir
- 2801 Westport Cir