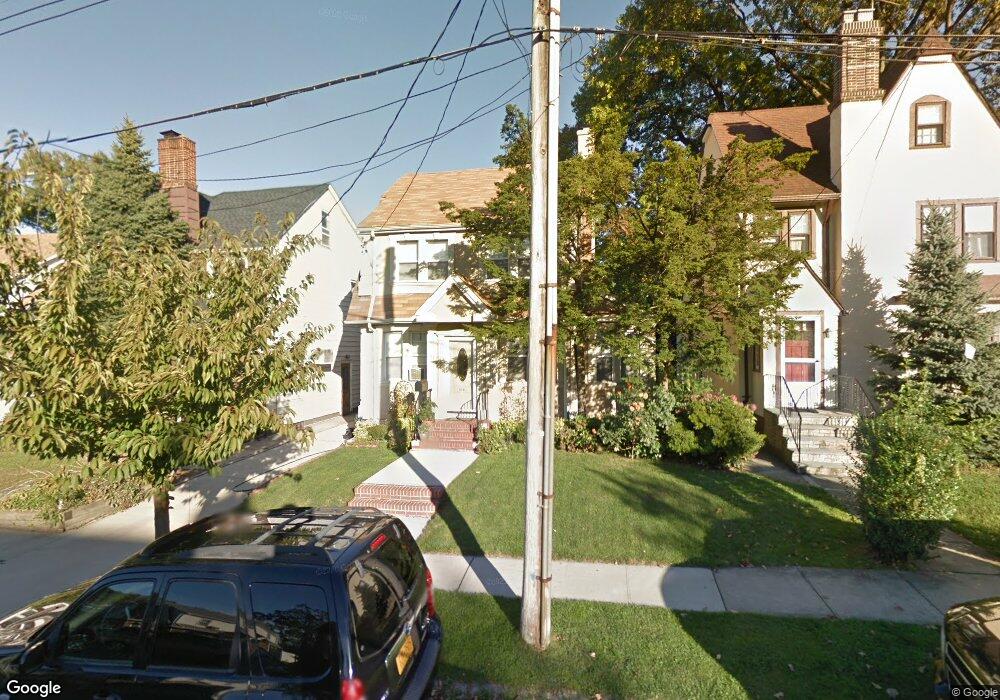
2921 162nd St Flushing, NY 11358
Murray Hill-Broadway NeighborhoodEstimated Value: $1,188,835 - $1,349,000
Studio
--
Bath
1,638
Sq Ft
$775/Sq Ft
Est. Value
About This Home
This home is located at 2921 162nd St, Flushing, NY 11358 and is currently estimated at $1,268,959, approximately $774 per square foot. 2921 162nd St is a home located in Queens County with nearby schools including P.S. 32 - State Street, I.S. 25 Adrien Block, and Francis Lewis High School.
Ownership History
Date
Name
Owned For
Owner Type
Purchase Details
Closed on
Jul 17, 2007
Sold by
Parliament Developers Inc
Bought by
Li Hong and Li Zheng
Current Estimated Value
Home Financials for this Owner
Home Financials are based on the most recent Mortgage that was taken out on this home.
Original Mortgage
$417,000
Outstanding Balance
$261,307
Interest Rate
6.73%
Mortgage Type
Purchase Money Mortgage
Estimated Equity
$1,007,652
Purchase Details
Closed on
Nov 2, 2005
Sold by
Tashkissi Omid
Bought by
Parliament Developers Llc
Home Financials for this Owner
Home Financials are based on the most recent Mortgage that was taken out on this home.
Original Mortgage
$385,000
Interest Rate
5.79%
Mortgage Type
Purchase Money Mortgage
Purchase Details
Closed on
Oct 11, 2005
Sold by
Estate Of Susanna Socci and Socci
Bought by
Tashkissi Omid
Home Financials for this Owner
Home Financials are based on the most recent Mortgage that was taken out on this home.
Original Mortgage
$385,000
Interest Rate
5.79%
Mortgage Type
Purchase Money Mortgage
Create a Home Valuation Report for This Property
The Home Valuation Report is an in-depth analysis detailing your home's value as well as a comparison with similar homes in the area
Home Values in the Area
Average Home Value in this Area
Purchase History
| Date | Buyer | Sale Price | Title Company |
|---|---|---|---|
| Li Hong | $670,000 | -- | |
| Li Hong | $670,000 | -- | |
| Parliament Developers Llc | -- | -- | |
| Parliament Developers Llc | -- | -- | |
| Tashkissi Omid | $550,000 | -- | |
| Tashkissi Omid | $550,000 | -- |
Source: Public Records
Mortgage History
| Date | Status | Borrower | Loan Amount |
|---|---|---|---|
| Open | Li Hong | $417,000 | |
| Closed | Li Hong | $417,000 | |
| Previous Owner | Tashkissi Omid | $385,000 |
Source: Public Records
Tax History
| Year | Tax Paid | Tax Assessment Tax Assessment Total Assessment is a certain percentage of the fair market value that is determined by local assessors to be the total taxable value of land and additions on the property. | Land | Improvement |
|---|---|---|---|---|
| 2025 | $10,363 | $52,597 | $16,471 | $36,126 |
| 2024 | $10,363 | $51,595 | $15,582 | $36,013 |
| 2023 | $9,844 | $49,014 | $15,134 | $33,880 |
| 2022 | $9,270 | $67,560 | $19,860 | $47,700 |
| 2021 | $9,230 | $60,960 | $19,860 | $41,100 |
| 2020 | $9,278 | $60,240 | $19,860 | $40,380 |
| 2019 | $8,994 | $59,820 | $19,860 | $39,960 |
| 2018 | $8,326 | $40,845 | $14,490 | $26,355 |
| 2017 | $7,888 | $38,695 | $14,722 | $23,973 |
| 2016 | $7,306 | $38,695 | $14,722 | $23,973 |
| 2015 | $4,403 | $36,526 | $19,312 | $17,214 |
| 2014 | $4,403 | $35,830 | $19,277 | $16,553 |
Source: Public Records
Map
Nearby Homes
Your Personal Tour Guide
Ask me questions while you tour the home.